
 AUS
AUS
 NZ
NZ
 UK
UK
 CA
CA
 USA
USA
 IND
IND








Crude oil prices are now witnessing a slight recovery post seven consecutive declines amid the Strategic reduction in crude oil inventory in the United States. After finally shunning away inventory and declining imports for many weeks, the United States witnessed a slight increase in imports and a reduction in exports.
Crude Oil Inventory Analysis:
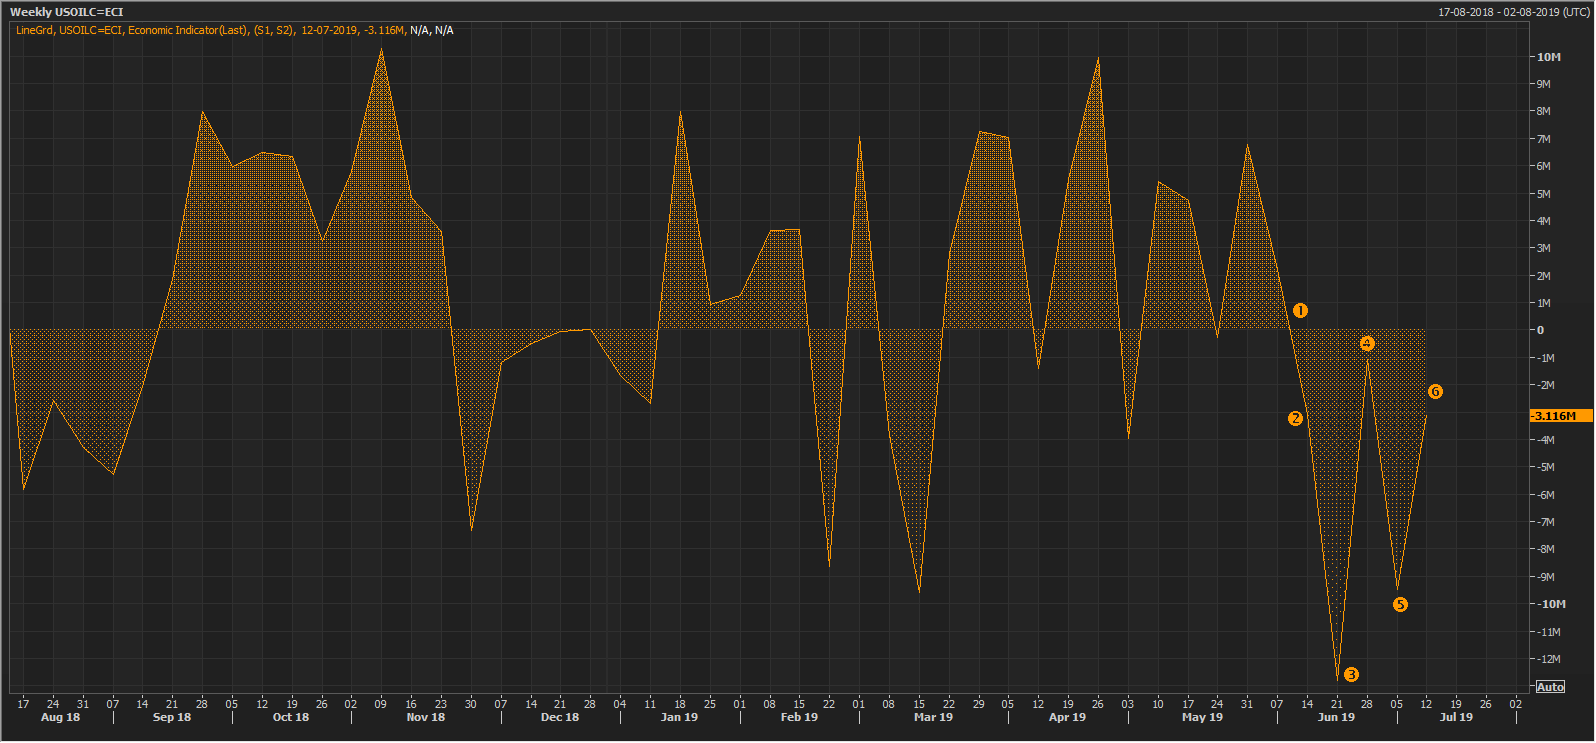
U.S. Weekly Crude Oil Inventory Change (Source: Thomson Reuters)
Post a decline of 9.5 million barrels, the crude oil inventory in the United States further decreased by 3.11 million barrels for the week ended 12 July 2019. However, this time, the decline in inventory was due to the impact of fall in the United States domestic crude output, which supported the crude oil prices in the market.
The United States Crude Oil Inventory witnessed a sixth consecutive decline from 1 June 2019 till the week ended 12 July 2019.
The U.S. Average Imports
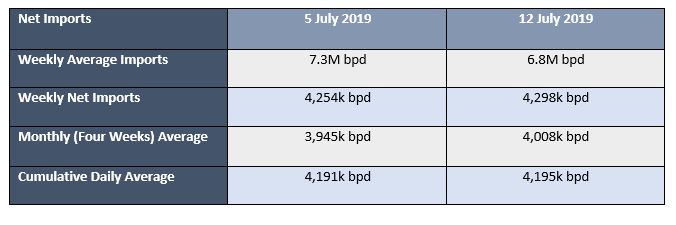
The crude oil average imports in the United States stood at 6.83 million barrels per day (12 July 2019), down by 470,000 barrels per day against the previous week average import of 7.3 million barrels per day. The crude oil import average, which previously revolved around the level of 7.5 million barrels per day, reached around the 21 June 2019 low average of 6.7 million barrels per day on 5 July 2019.
The U.S. Net Imports:
The net imports in the United States inched up despite a fall in average imports amid fall in the export and domestic production of crude oil. As per the data, the net imports in the United States including the import for the strategic petroleum reserves (SPR) stood at 4,298K barrels per day for the week ended 12 July 2019, up by over 1 per cent as compared to the previous week net import of 4,254k barrels per day.
The four weeks (monthly) average of net imports (including SPR) for the week ended 12 July 2019 stood at 4,008k barrels per day, up by over 1.50 per cent against the four-week average of 3,945k barrels per day for the week ended 5 July 2019.
Apart from an increase in the monthly average, the net imports (including SPR) also witnessed a rise in the cumulative daily average. As per the data, the cumulative daily average for the week ended 12 July 2019 stood at 4,195k barrels per day, against the previous week cumulative daily average of 4,191k barrels per day.
The U.S. Domestic Production:
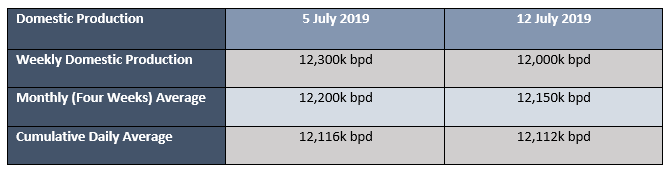
The domestic production of crude oil for the week ended 12 July 2019 stood at 12,000k barrels per day, down by 300 barrels per day or by over 2.43 per cent against the previous week domestic production of 12,300k barrels per day.
The monthly average (four weeks) for the domestic production stood at 12,150k barrels per day for the week ended 12 July 2019, down by 50k barrels per day against the previous week monthly average of 12,200k barrels per day.
The cumulative daily average also witnessed a slight decline, and the daily average stood at 12,112k barrels per day for the week ended 12 July 2019, down by 4k barrels per day against the previous week daily average of 12,116k barrels per day.
The U.S. Exports:
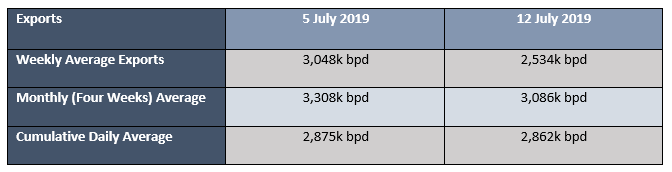
The exports of crude oil from the United States stood at 2,534k barrels per day (as on 12 July 2019), down by over 16.80 per cent against the previous week exports of 3,048k barrels per day.
The monthly (four weeks) export average for the week ended 12 July stood at 3,086k barrels per day, down by over 6.5 per cent against the previous week monthly average export of 3,308k barrels per day.
The cumulative daily export average stood at 2,862k barrels per day for the week ended 12 July 2019, down by over 0.45 per cent from the previous week daily average of 2,875k barrels per day.
The overall crude oil inventory in the United States (excluding SPR) stood at 455.9 million barrels for the week ended 12 July 2019, slight down against the previous week overall inventory of 459.0 million barrels.
In a nutshell, the net imports in the United States surged, and the domestic production and exports witnessed a fall, which in turn, reduced the overall inventory by 3.11 million barrels and supported the crude oil prices.
Crude Oil on Charts:
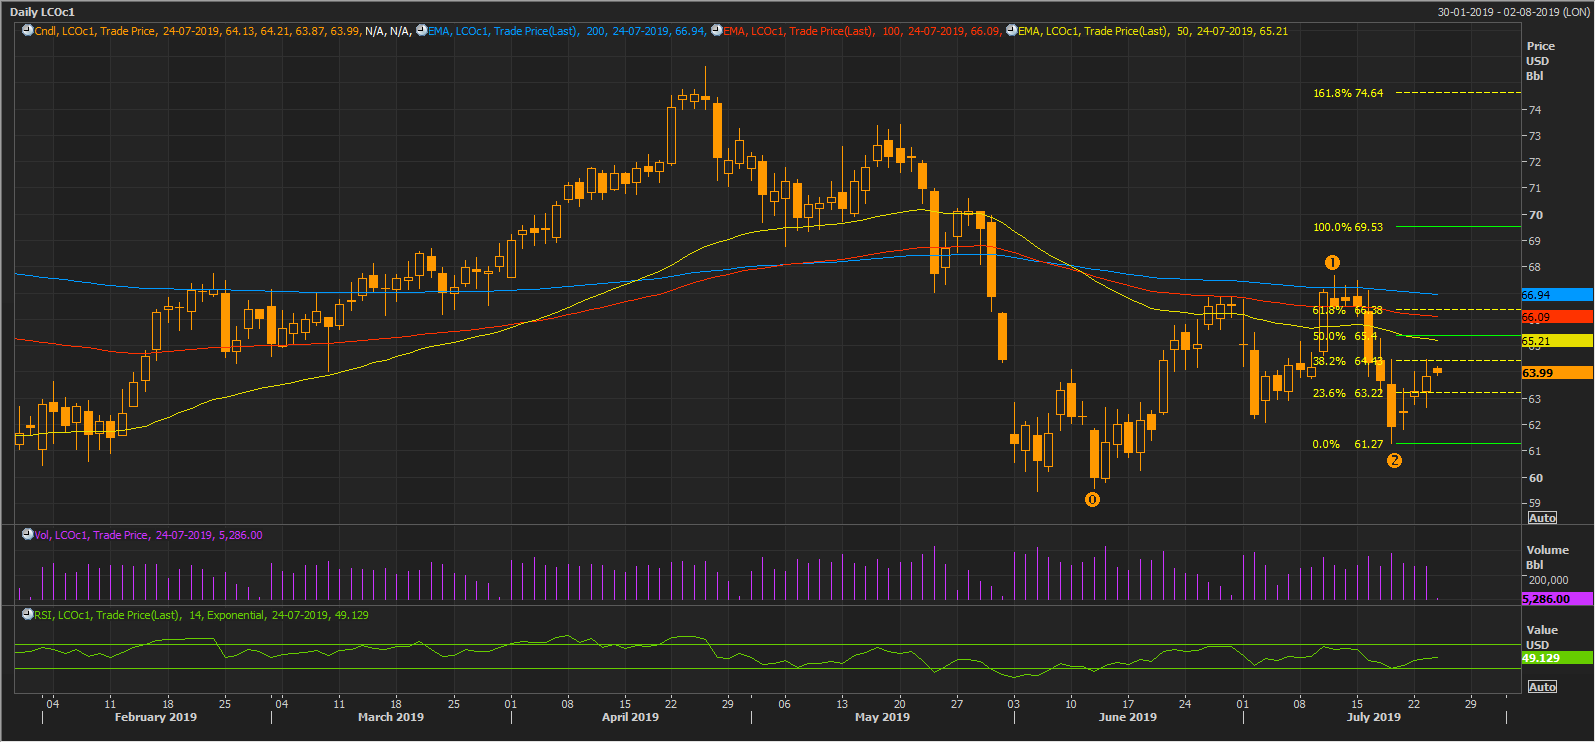
LCO Daily Chart (Source: Thomson Reuters)
On a daily chart, the crude oil prices are showing slight recovery; however, the prices are trading below the trio of 200,100, and 50-days EMAs, which in turn, could provide a hurdle for the crude oil prices over the short-term. The prices could face a primary hurdle at the level of US$64.43, which is the 38.2 per cent projected level of the Fibonacci series.
The slight recovery in the crude oil prices raised optimism among the energy companies, and the energy players on the Australian Securities Exchange (ASX) recovered from their recent low.
ASX-Listed Energy Players:
Origin Energy Limited (ASX: ORG)
ORG, the Australian Securities Exchange (ASX) listed oil explorer and producer, moved up in the market supported by the recovery in crude oil prices. The shares of the company surged from the level of A$7.310 (Dayâs low on 19 July 2019) to the present high of A$7.810 (as on 24 July 2019, 03:53 PM AEST).
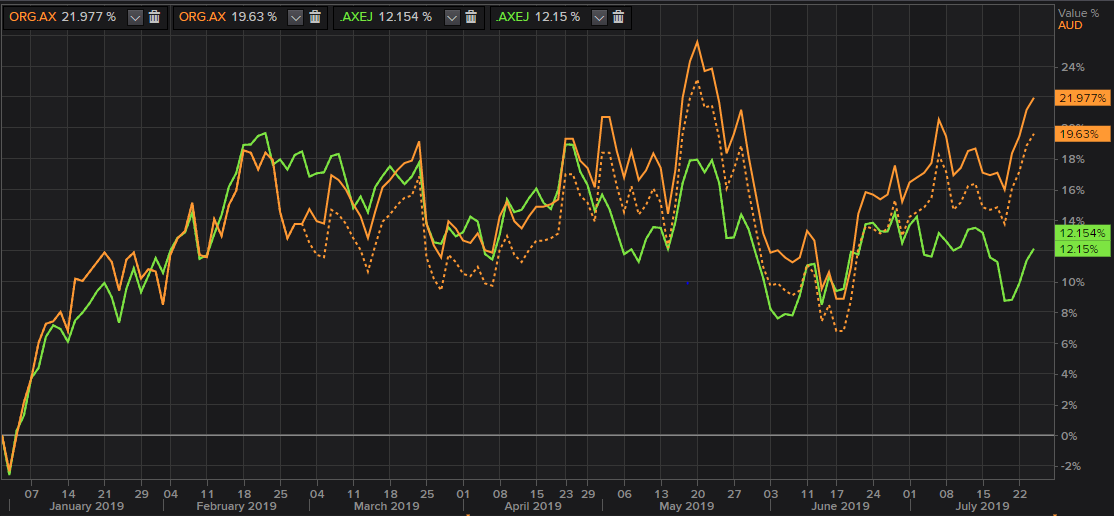
ORG and S&P/ASX 200 Energy Index YTD Returns(Source: Thomson Reuters)
On comparing the YTD returns of the company against the S&P/ASX 200 Energy Index, the stock of the company outperformed the index. ORG delivered a total return of 21.977 per cent on a YTD basis and an absolute price change return of 19.63 per cent while the S&P/ASX 200 Energy Index delivered a return of 12.154 per cent on a YTD basis.
AGL Energy Limited (ASX: AGL)
The Australian energy player- AGL recently recovered from the level of A$20.090 (Dayâs low on 18 July 2019) to the present high of 21.040 (as on 24 July 2019, 04:13 PM AEST).
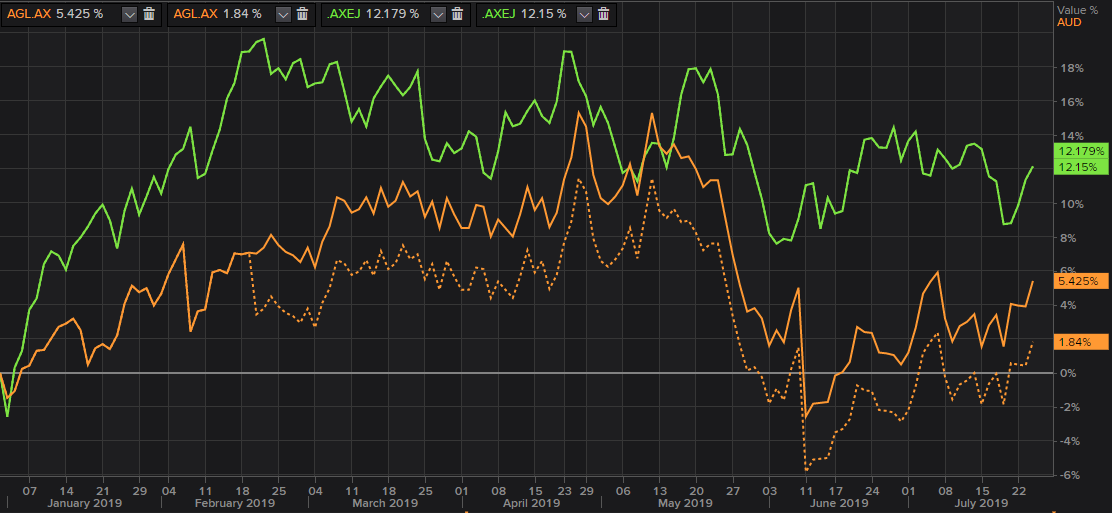
AGL and S&P/ASX 200 Energy Index YTD Returns(Source: Thomson Reuters)
On comparing the YTD returns of the company against the S&P/ASX 200 Energy Index, the stock of the company underperformed the index. AGL delivered a total return of 5.425 per cent on a YTD basis and an absolute price change return of 1.84 per cent while, the S&P/ASX 200 Energy Index delivered a return of 12.154 per cent on a YTD basis.
Liquified Natural Gas Limited (ASX: LNG)
The Australian Energy player- LNG surged from the recent low of A$0.230 (Dayâs low on 19 July 2019) to the level of A$0.300 (Dayâs high on 23 June 2019). However, the prices again plunged in the market and dropped to the present level of A$0.260 (as on 24 July 2019, 04:26 PM AEST)
On comparing the YTD returns of the company against the S&P/ASX 200 Energy Index, the stock of the company underperformed the index. LNG delivered a total return of -49.51 per cent on a YTD basis and an absolute price change return of -49.51 per cent while, the S&P/ASX 200 Energy Index delivered a return of 12.154 per cent on a YTD basis.
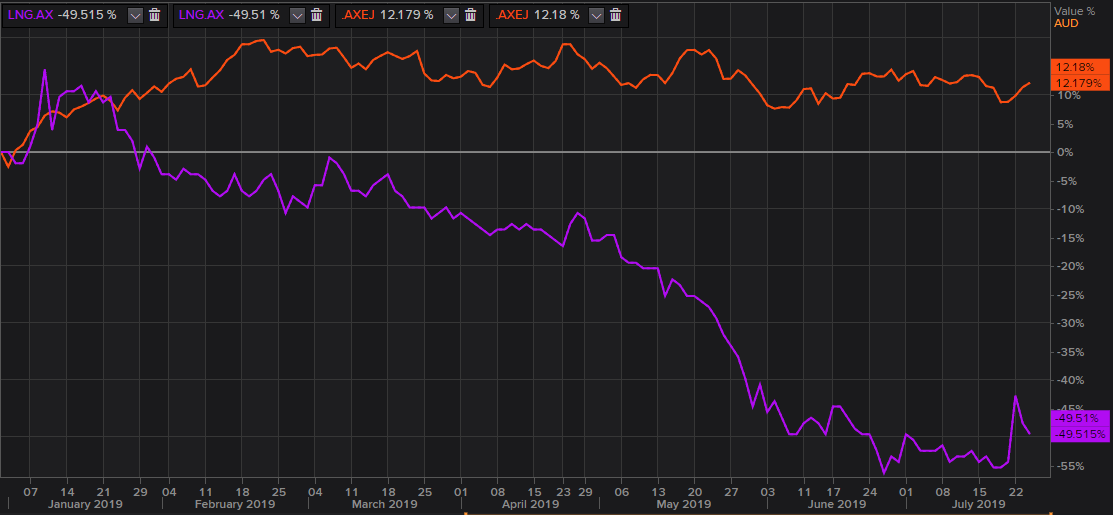
LNG and S&P/ASX 200 Energy Index YTD Returns(Source: Thomson Reuters)
Comparative Returns:
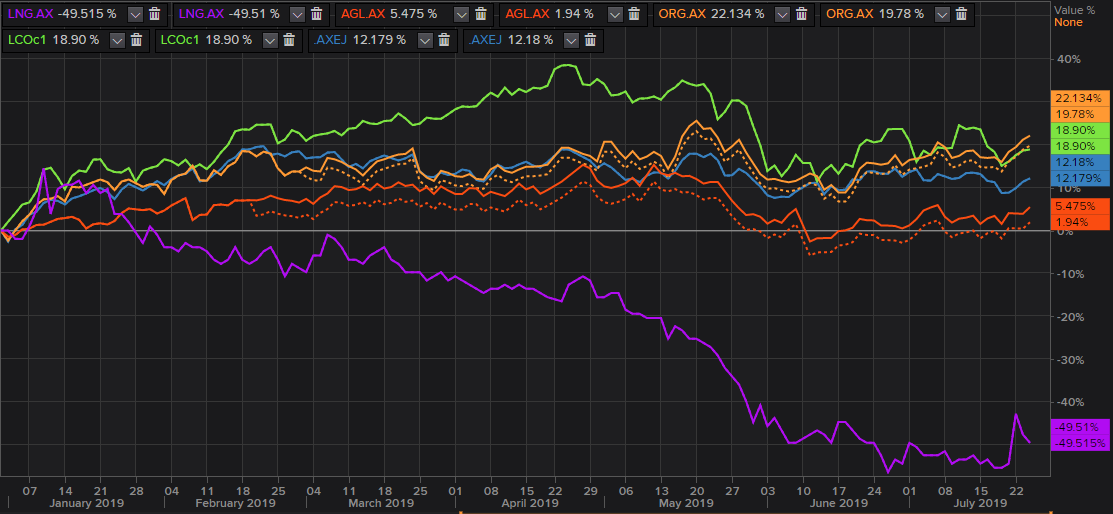
ORG, AGL, LNG, LCO and S&P/ASX 200 Energy Index YTD Returns(Source: Thomson Reuters)
On comparing the returns of all the above three stocks with the crude oil price return and the S&P/ASX 200 Energy Index return, we can see that ORG outperformed the rest with a total return of 22.134 per cent.
The S&P/ ASX 200 Energy Index underperformed the return from crude oil prices change on a YTD basis; however, ORG outperformed the index as well as oil, which in turn, suggests a superior YTD returns from the stock of the company.
Disclaimer
This website is a service of Kalkine Media Pty. Ltd. A.C.N. 629 651 672. The website has been prepared for informational purposes only and is not intended to be used as a complete source of information on any particular company. Kalkine Media does not in any way endorse or recommend individuals, products or services that may be discussed on this site. Our publications are NOT a solicitation or recommendation to buy, sell or hold. We are neither licensed nor qualified to provide investment advice.
