


Crude prices have taken a sharp rebound from its recent low level amid a shortfall in the United States Crude Oil Inventory. The Brent Oil Futures zoomed from the level of US$62.09 (Dayâs low on 3rd July) to the present high of US$67.25 (as on 11th July 2019 1:25 PM AEST).
Crude Oil Inventory Analysis:
The United States Weekly Crude Oil Inventory marked a decline for the sixth consecutive week, which in turn, supported the crude oil prices. As per the data, the crude oil stockpiles in the United States declined by further 9.5M (approx.) for the week ended 5th July 2019.
However, the decline is inventory looks rather strategic, and investors should dig out for the fundamentals of oil demand and supply before taking any position in the market.
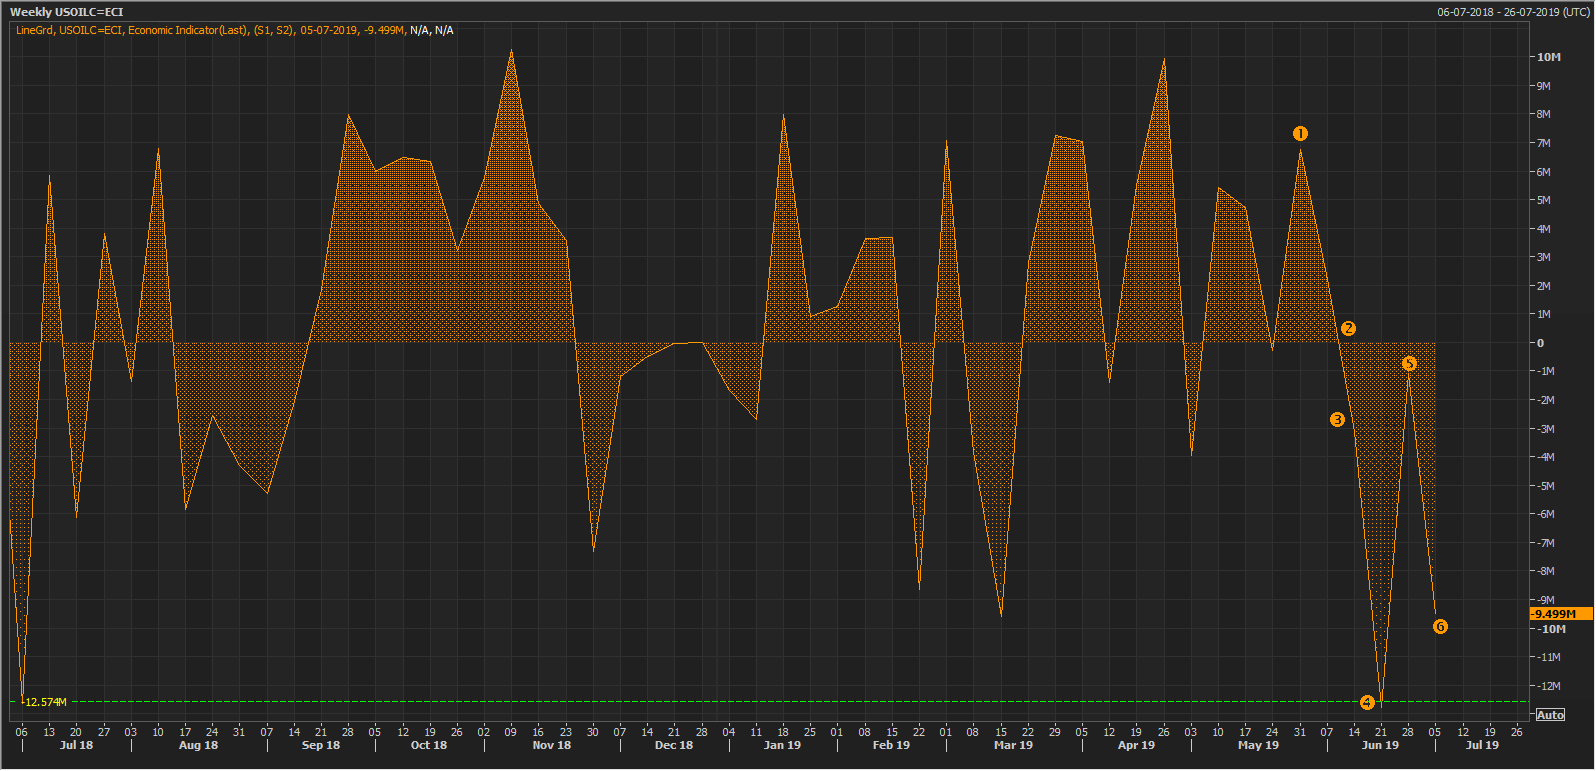
U.S. Weekly Crude Oil Inventory (Source: Thomson Reuters)
The United States Crude Scenario:
The Crude oil imports in the United States averaged at 7.3 million barrels per day for the week ended 5th July 2019, which was down by 284,000 barrels per day from the previous week import average of 7.6 million barrels per day. However, the imports are higher than the low average import of 6.7 million barrels per day witnessed for the week ended 21st June 2019.
Post the decline in average import (21st June 2019), the United States crude oil import is revolving around the average of 7.5 million barrels per day.
Is the United States Reducing External Crude Exposure?
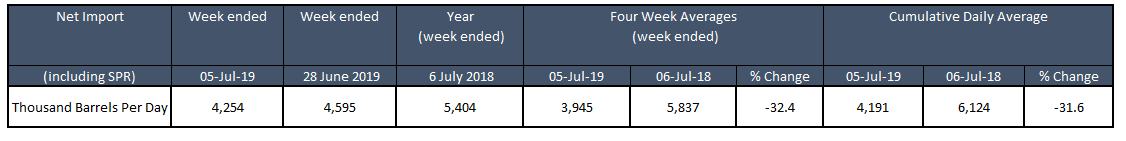
Net Imports Scenario:
The United States imported 4,254k barrels per day including the imports for strategic petroleum reserves (SPR) for the week ended 5th July 2019, which was down by 342k barrels per day from the previous week net import (including SPR) of 4,595k barrels per day.
Apart from a weekly decline, the nation also witnessed a decrease in yearly net import. As per the data, the net import (including SPR) stood at 5,404k barrels per day on 6th July 2018, which in turn, marked a net decline of 1,150k barrels per day or over 21 per cent on the week ended 5th July 2019.
The four-week (monthly) average on 7th June 2019 of net imports (including SPR) stood at 3,945k barrels per day, down by 32.4 per cent from the four-week net import average of 5,837k barrels per day in the previous corresponding tenure on 6th June 2018.
The Cumulative Daily Average of crude net import (including SPR) stood at 4,191k barrels per day for the week ended 5th June 2019, down by 31.6 per cent form the Cumulative Daily Average of 6,124k barrels per day for the week ended 6th June 2018.

(Data Source: EIA)
Domestic Production Scenario:
The net imports in the United States are witnessing a decline, while the domestic production is inching up rapidly.
The domestic production in the United States for the week ended 5th July 2019 stood at 12,300k barrels per day, which was 100k barrels per day more than the previous week domestic production of 12,200k barrels per day.
Not just on a weekly basis, the domestic production in the United States also underpinned a yearly growth. As per the data, the domestic production stood at 10,900 barrels per day on 7th June 2018, which in turn, witnessed growth over 12.80 per cent in one year.
The four-week (monthly) average on 7th June 2019 of the domestic production stood at 12,200k barrels per day, up by 11.9 per cent from the four-week net import average of 10,900k barrels per day in the previous corresponding tenure on 6th June 2018.
The Cumulative Daily Average of crude domestic production stood at 12,116k barrels per day for the week ended 5th July 2019, up by 15.6 per cent form the Cumulative Daily Average of 10,484k barrels per day for the week ended 6th July 2018.
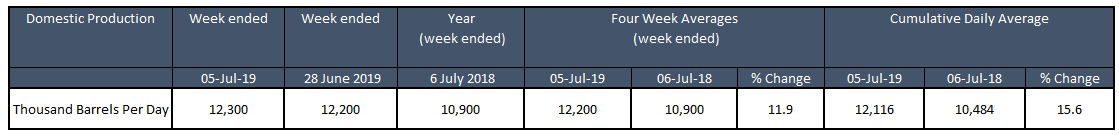
(Data Source: EIA)
Net Exports Scenario:
The net import declined in the United States and domestic production witnessed a growth; however, to move neck to neck with the OPEC members, the United States exports the crude oil in the international market to put a curb on the prices.
The net export from the United States stood at 3,048k barrels per day for the week ended 5th July 2019, up by over 1.90 per cent from its previous week exports of 2,990k barrels per day. The net exports also witnessed a yearly growth, and as per the data, the exports of crude oil from the United States stood at 2,027k barrels per day (as on 6th July 2018), which in turn, underpinned the growth of over 50 per cent.
The four-week (monthly) average on 7th July 2019 of the exports stood at 3,308k barrels per day, up by 35.9 per cent from the four-week export average of 2,434k barrels per day in the previous corresponding tenure on 6th July 2018.
The Cumulative Daily Average of crude export stood at 2,875k barrels per day for the week ended 5th July 2019, up by 56.9 per cent form the Cumulative Daily Average of 1,833k barrels per day for the week ended 6th July 2018.
(Data Source: EIA)
In a nutshell, the United States reduced its net imports amid high domestic production, which is now flowing to the international market in terms of high exports. The investors should keep a close eye over the net exports and domestic production counter along with the net imports to gauge the demand and supply dynamics.
Apart from the United States, OPEC also plays a substantial role is controlling the oil prices, and in a recent meeting, the cartel along with Russia had decided to curb the production by approx. 1.25 per cent of the global consumption, which, in turn, is supporting the crude oil prices in the international market.
However, recently Aramco, the oil kingpin Saudiâs state-owned company, awarded around US$18 billion in contracts to boost the oil output, and investors should keep a close eye over the production scenario from the OPEC cartel.
Crude Oil on Charts:
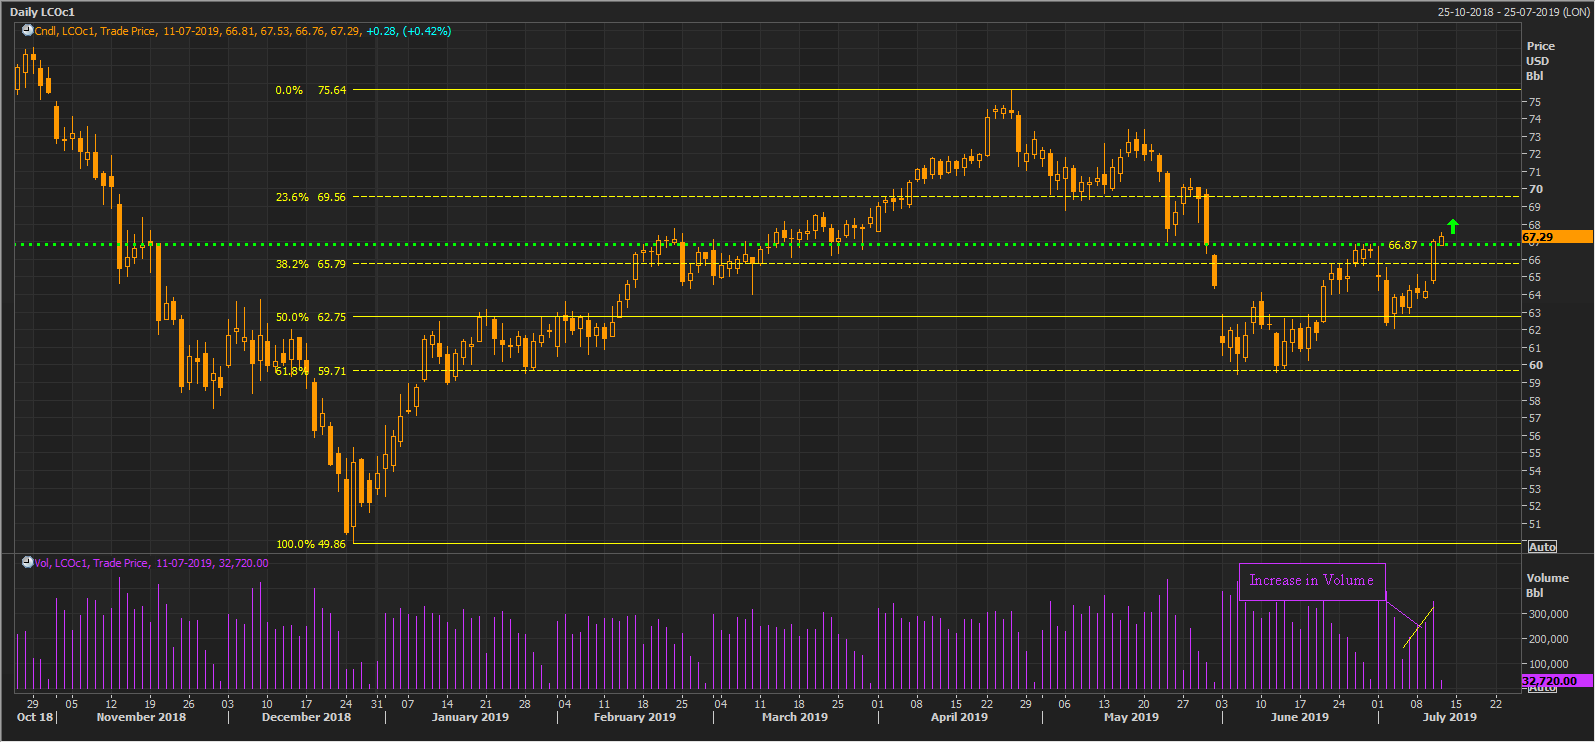
LCO Daily Chart (Source: Thomson Reuters)
The prices started an upside rally from the level of approx. US$49.86 to the level of approx. US$75.64. Post hitting the level of US$75.64, the prices retracted over 61.8 per cent and resumed the initial uptrend. On a daily chart, the crude oil prices have recently crossed its primary hurdle of approx. US$66.87, which would now act as the support, and investors should keep a close eye around the level as a sustenance above the same, and a break below would decide further price action in it.
On the volume counter, the upside in crude was highly supported by the volume trend; on the chart, the new highs are well supported by the increasing volume, which in turn, denoted good bull strength.
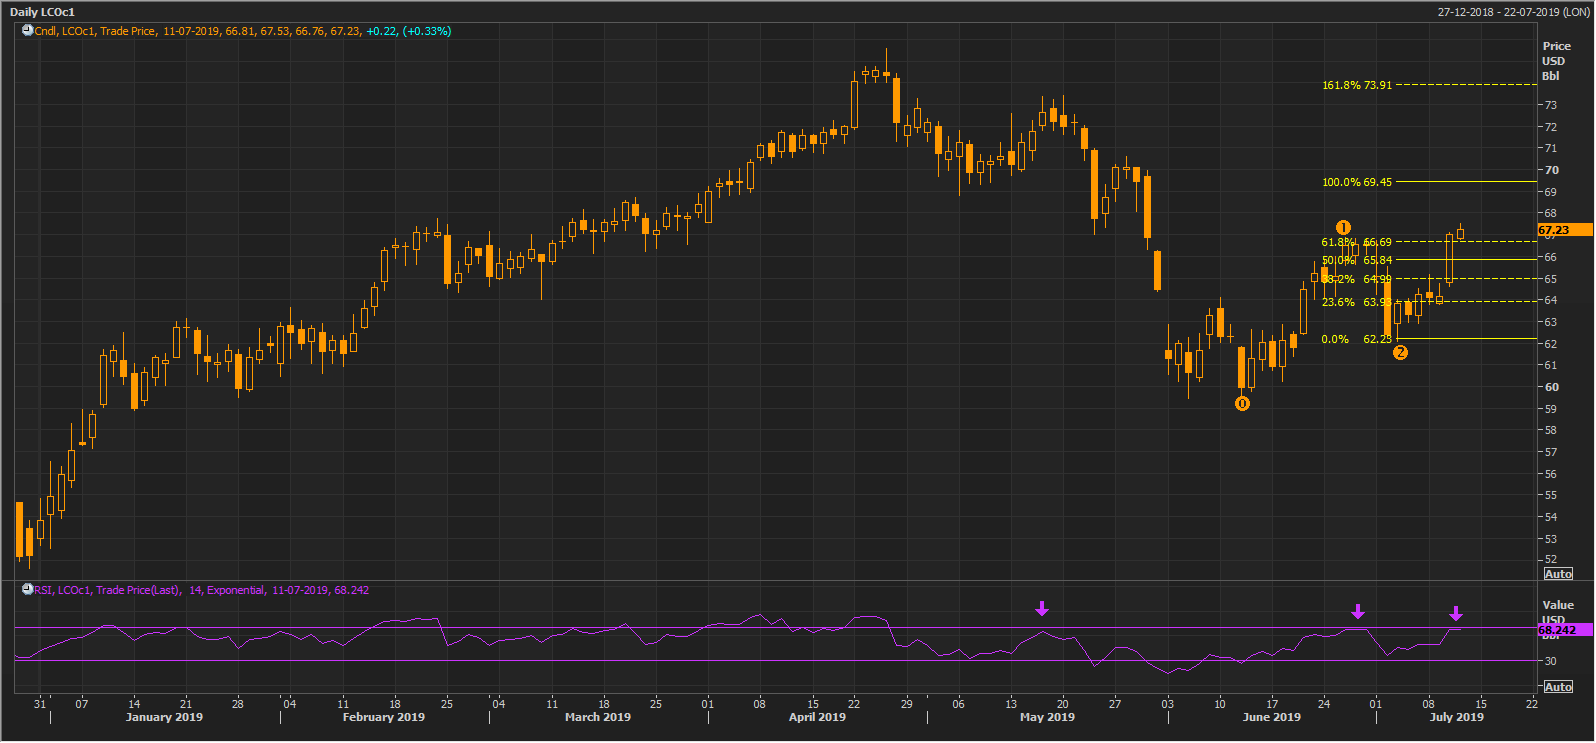
LCO Daily Chart (Source: Thomson Reuters)
On further analysing the daily chart, we can observe that the recent correction, which took prices below the 61.8 per cent retracement level and the re-bounce gave perfect points (marked as 0,1,2) to connect the Fibonacci Series. On following the projections, we can observe that the prices recently crossed the level of 61.8 per cent projection, which stood at US$66.69.
And on the technical indicator, the 14 days Relative Strength Index is near its previous hurdle of 70.0. The prices could take a support of 61.8 per cent projected level, and investors should keep a close eye around the level as a break below could witness a short-term correction, as indicated by the RSI.
The 100.0 per cent projected level of the Fibonacci is at US$69.45, which could offer a short-term resistance to the prices.
Post Understanding the crude oil scenario and what to look at before entering the oil market, let us now take a look at the return profile of few ASX-listed energy players, as energy players generally hold exposure to the crude oil prices in the market.

Comparative Daily Chart (Source: Thomson Reuters)
On following the chart shown above, we can see, that the selected energy players are closely moving in tandem with the crude oil price movement. Over the recent upside in the crude oil prices the oil energy players on the Australia Securities Exchange have witnessed a decent percentage change in June 2019.
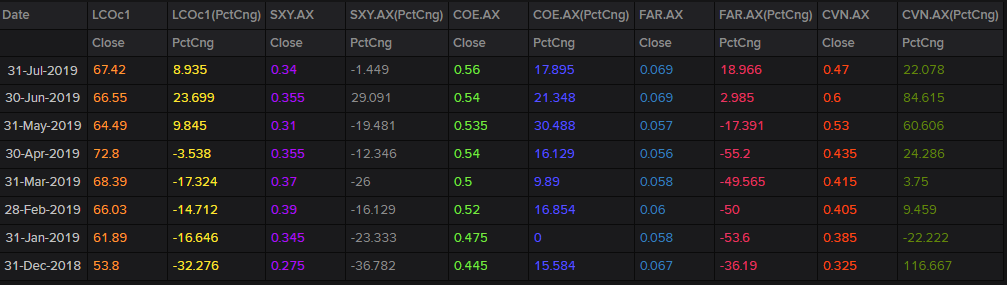
(Source: Thomson Reuters)
Over the recent upside rush in the crude oil prices in June, the oil players such as ASX-listed Senex Energy Limited (ASX:SXY), Cooper Energy Limited (ASX:COE), FAR Limited(ASX:FAR), and Carnarvon Petroleum Limited (ASX:CVN), witnessed a good upside. The YTD return for crude stands over 25 per cent (as on 11th July 2019 6:31 PM AEST).
The decent YTD returns from the crude oil supported the energy players on ASX, and stocks delivered good YTD returns.
Carnarvon Petroleum Limited (ASX: CVN), delivered a YTD return of 43.94 per cent (as per the 10th June closing price), while Cooper Energy Limited (ASX: COE), delivered a YTD return of 19.77 per cent (as per the 10th June closing price).
FAR Limited (ASX: FAR), the company standing against the popular ASX energy player- Woodside Petroleum Limited (ASX: WPL), in the arbitration proceedings delivered a YTD return of 1.49 per cent.
Investors should keep a close eye on the energy sector players, as many industry experts believe that the energy sector would dominate the upcoming estimated upside in the S&P 500 Index.
Disclaimer
This website is a service of Kalkine Media Pty. Ltd. A.C.N. 629 651 672. The website has been prepared for informational purposes only and is not intended to be used as a complete source of information on any particular company. Kalkine Media does not in any way endorse or recommend individuals, products or services that may be discussed on this site. Our publications are NOT a solicitation or recommendation to buy, sell or hold. We are neither licensed nor qualified to provide investment advice.
