


Crude oil prices are moving down in the international market amid lesser global and the United States demand. The prices of Brent Oil Futures fell from the level of US$66.84 (Dayâs high on 28th June 2019) to the level of US$62.09 (Dayâs low on 3rd July 2019).
Post hitting the level of US$62.09, the duo of G-20 and OPEC meeting supported the prices again, and the Brent Crude Oil Futures settled at US$63.84 yesterday, more than 2.30 per cent higher as compared to its previous close.
The decline in the United States Crude Oil Inventory slightly supported the crude oil prices; however, the decline in the United States Crude stockpiles look strategic as the nation is relying on the domestic supply chain to meet the local demand.
Inventory Analysis:
The United States Weekly Crude Oil Inventory declined by 1.1 million on 28th June 2019 post a massive decline of 12.8M in the previous corresponding period. The reduction of 1.1 million barrels from the total inventory level in the United States marked a fourth consecutive weekly decline.
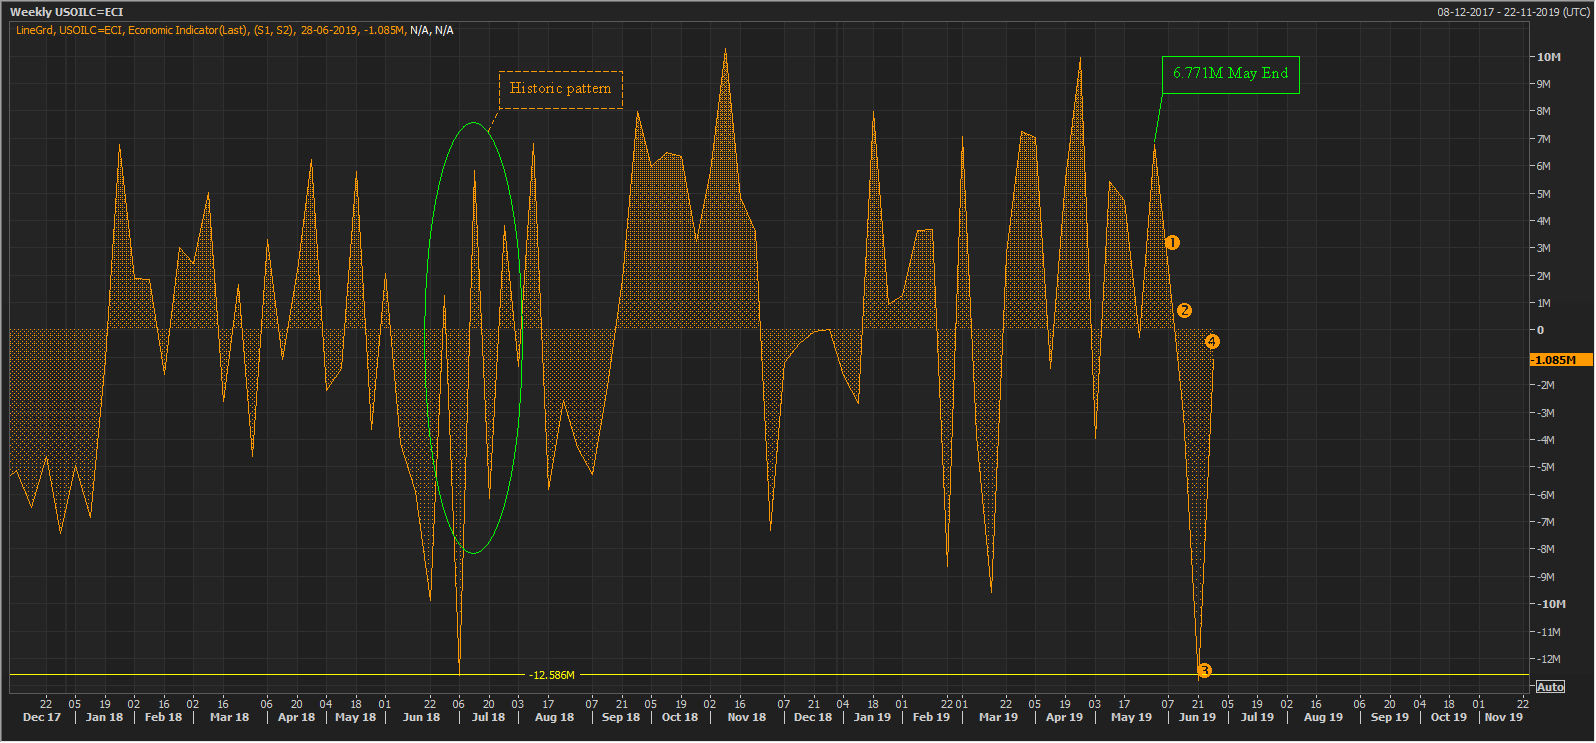
U.S. Weekly Crude Inventory Decline (Source: Thomson Reuters)
Post an addition of 6.771 million barrels in the domestic inventory, the United States reduced the domestic inventory by increasing the refinery inputs. The pattern recorded in the month of June 2018 (historic pattern) suggests that post such a hefty decline, the United States boost its inventory, a similar action in turn, could underpin a high demand from the United States, and support the crude oil prices.
Import and Refinery Activities:
The United States oil refinery inputs average remained same as compared to previous two weeks and stood at 17.3 million barrels; however, post an increase in refinery inputs of 73,000 barrels for the week ended 21st July 2019 the oil refinery inputs in the United States declined by 47,000 barrels per day, albeit the refineriesâ operating capacity remained unchanged and stood at 94.2 per cent.
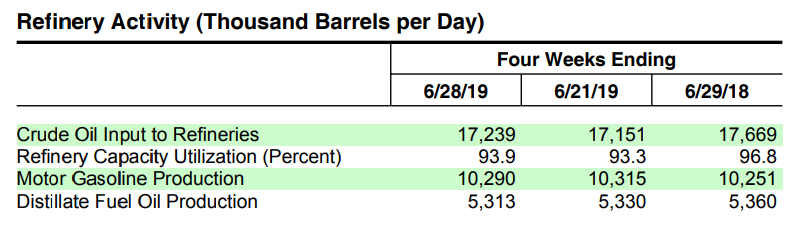
Source: EIA
The reduction in the crude oil refinery inputs could further justify why the crude stockpiles in the United States declined with a slow rate till 28th June 2019.
The total inventory in the United States declined despite the higher import till the week ended 28th June. As per the data, the United States crude oil import averaged at 7.6 million barrels per day (for the week ended 28th June), up by 929,000 barrels per day as compared to its previous average import of 6.7 million barrels per day (as on 21st June).
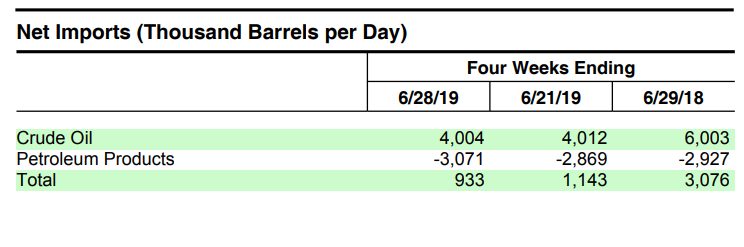
Source: EIA
The decline in the domestic inventory despite a higher import suggests a high domestic demand for crude oil in the United States.
However, the four-week average import declined by 13.1 per cent as compared to the same corresponding period in 2018 to stand at 7.3 million barrels a day (as on 28th June).
The total Crude Oil Inventory in the United States excluding those in the strategic petroleum reserve (SPR) now stands at 468.5 million barrels (as on 28th June), down by 1.1 million barrels as compared to the previous level of 469.6 million barrels.
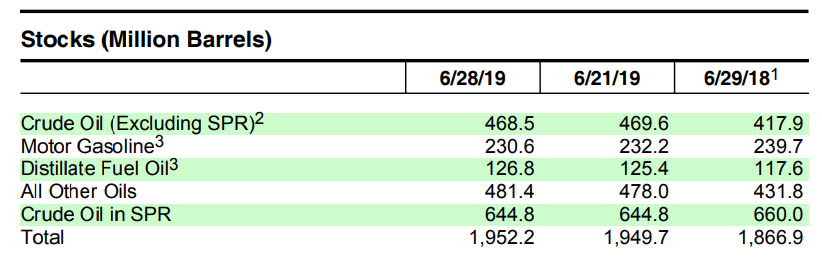
Source: EIA
Despite a fall, the total crude inventory is about 5 per cent higher as compared to the five year average., which in turn, could exert pressure on crude imports in the United States if the domestic economic conditions do not revive.
OPEC Stance and Demand Scenario:
On 30th June, the Russian President Vladimir Putin mentioned to media that the nation agreed with the oil kingpin Saudi to stretch the pact and decided to cut the accumulative production by 1.2 per cent of the global oil demand or 1.2 million barrels a day.
As per the OPEC June oil market report, the world oil demand is estimated to inch up by 1.14 million barrels per day in 2019, which is 0.07 million barrels down from May report. The OPEC reduced the demand projection amid poor first quarter in 2019 in the global economies.
And to overcome the sluggish demand, the Organization of Oil Exporting Countries, in its monthly meeting decide to keep the production low, and the OPEC cartel and Russia further indicated towards a further supply cut in the coming months to support the global oil prices.
The OPEC monthly meet outcome supported the crude oil prices on 02 July 2019, and in a nutshell, the crude import in the United States could improve amid higher domestic demand if the economic conditions improve.
And apart from that, the oil exporting cartel is still inclined towards supporting the crude oil prices. The energy investors should keep a close eye in the United States weekly oil import to reckon the demand and supply dynamics.
Crude Oil on Charts:
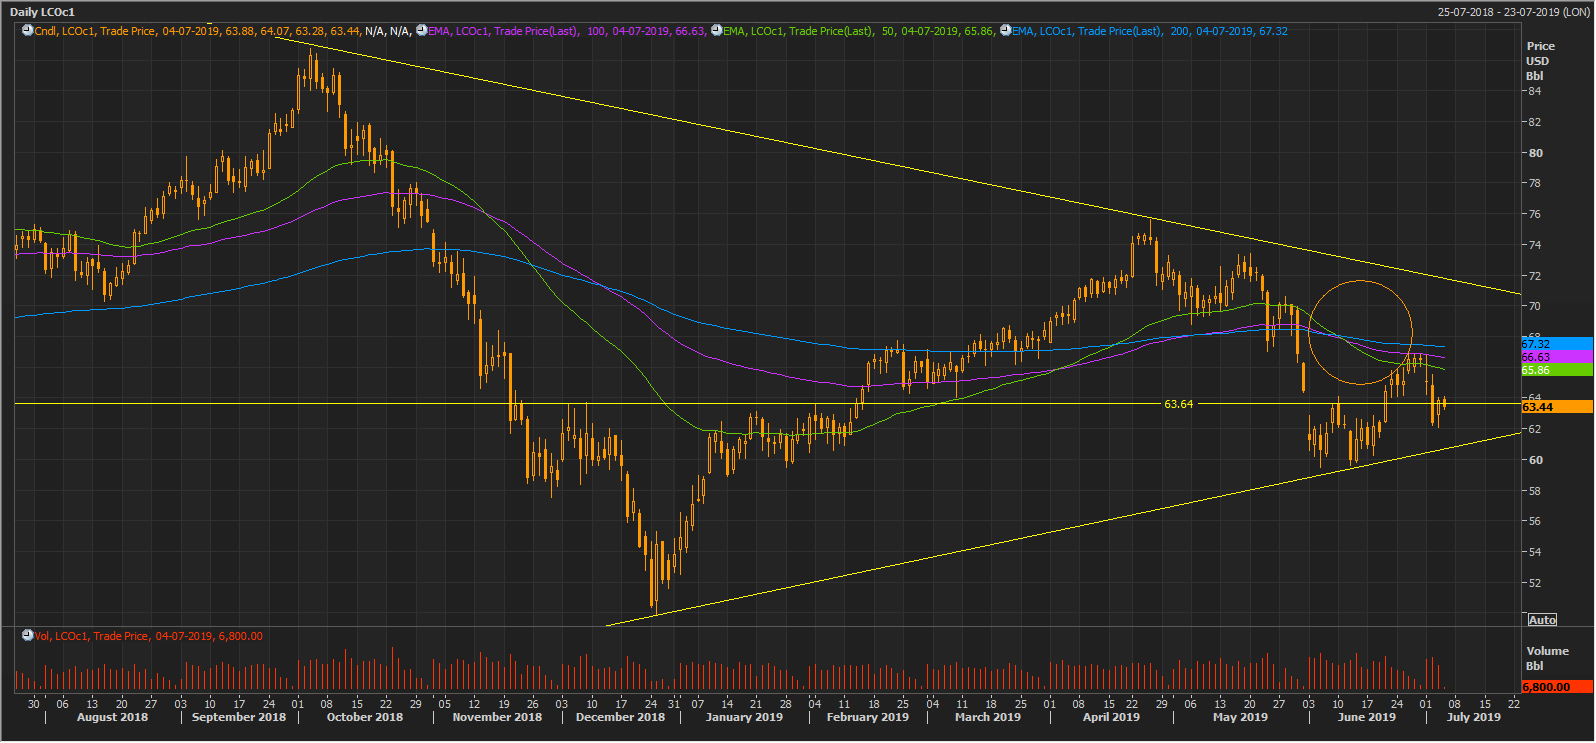
LCO Daily Chart (Source: Thomson Reuters)
On a daily chart, the crude oil prices are trading below its trio of 200,100, and 50-days exponential moving averages, which are at US$67.32 US$66.63, and US$65.86 respectively. The prices slipped below the trio post witnessing a Death Cross (bearish signal) of 200,100 and 50-days EMA. The crude oil prices also slipped below its support level of approx. US$63.44; however, the prices again crossed the same level and is currently revolving around it.
The investors should keep a close watch around the level of US$63.44, as the level is providing the support to the crude oil prices, a break below or move above the same level would decide further price action.
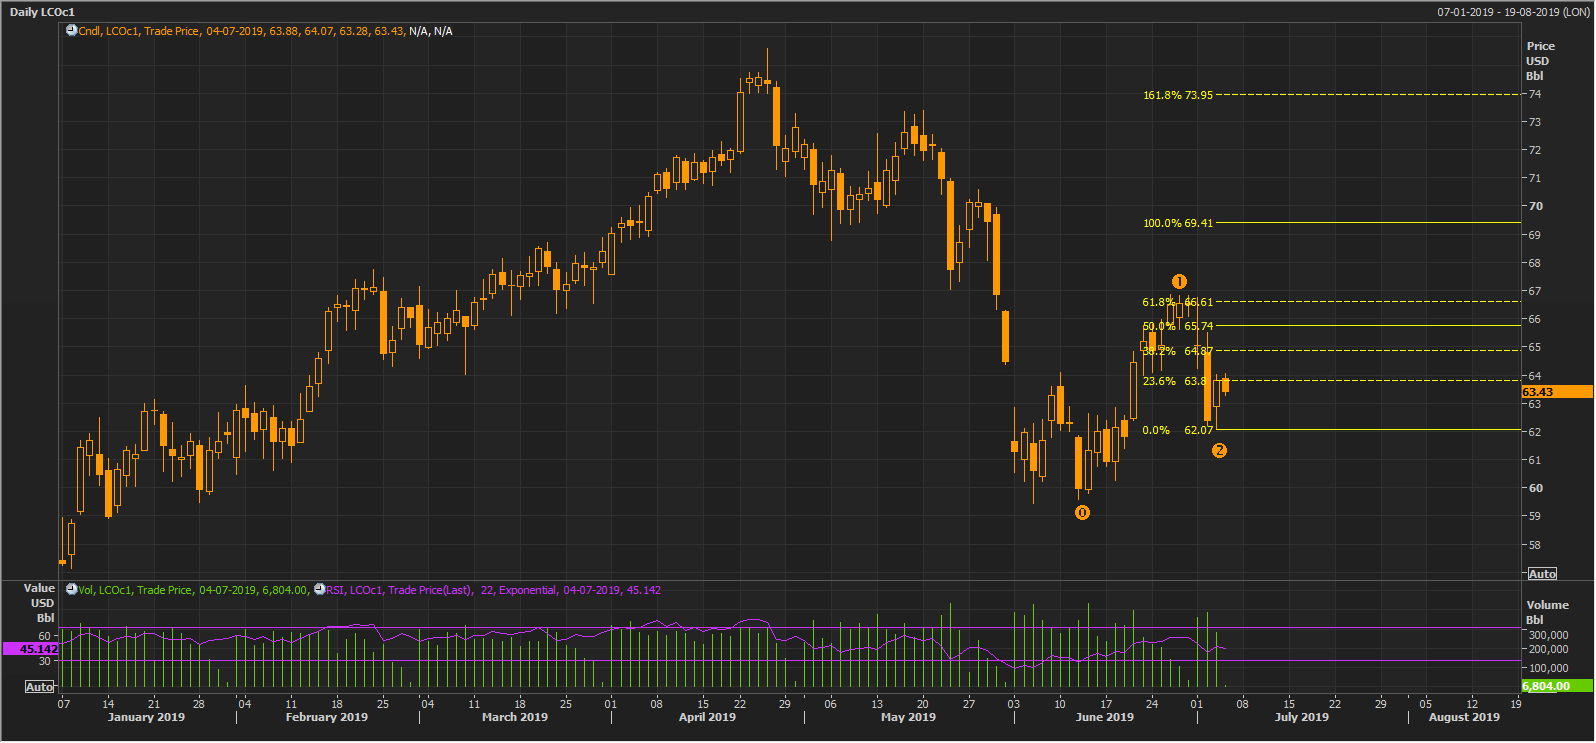
LCO Daily Chart (Source: Thomson Reuters)
On further connecting the Fibonacci projection through the points marked as 0,1,2 on the chart shown above, it can be seen, that the prices are currently taking the hurdle of 23.6 per cent projected level, which is at US$63.80.
Crude oil and the ASX-listed BPT:
Post addressing the crude oil scenario, let us now take a look at the Australian Securities Exchange listed oil and gas explorer.
Beach Energy Limited (ASX: BPT)
The share price of the company is closely tracking the movement in crude oil prices, as the market participants discount the shares of the company as per the crude oil movement.
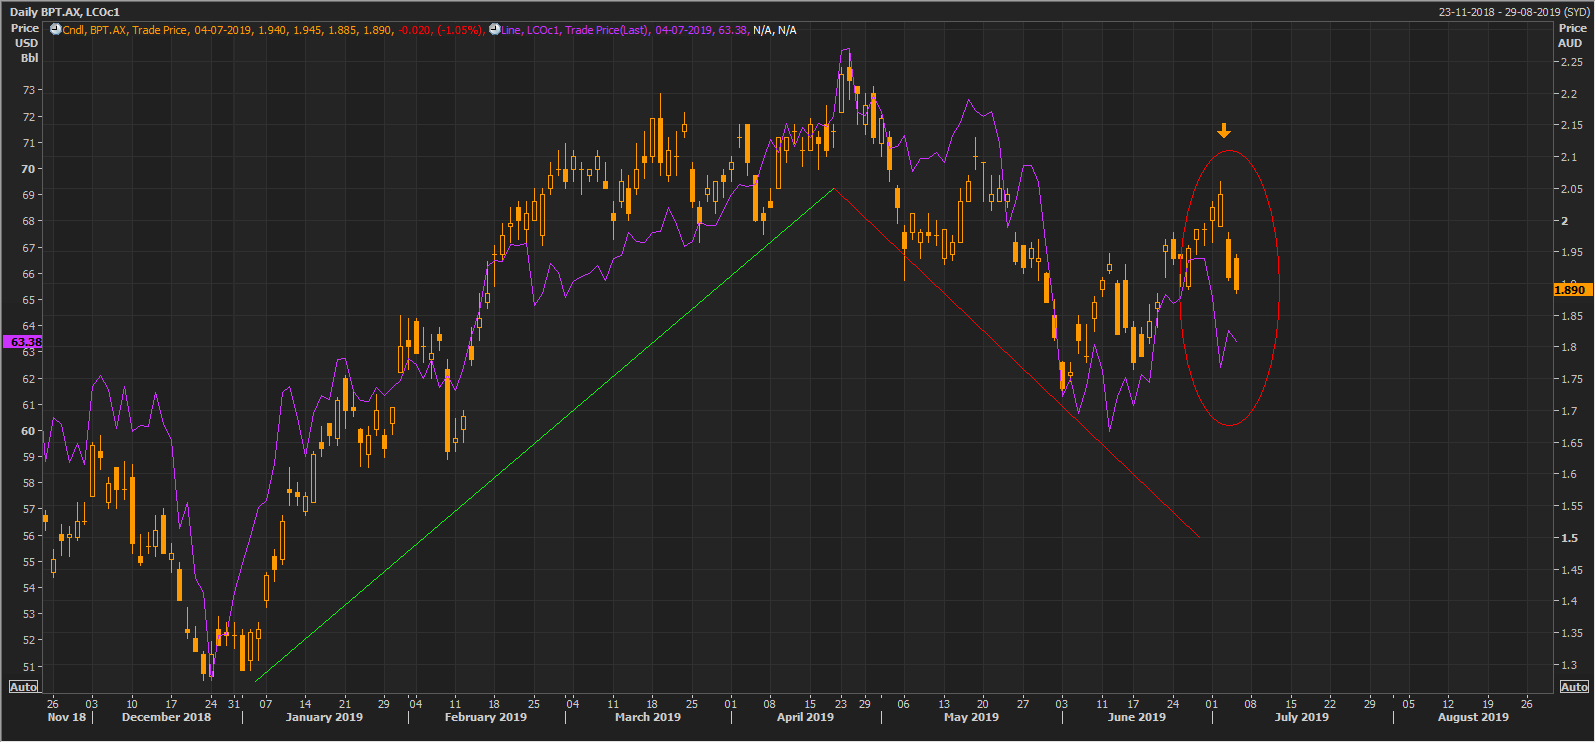
LCO & BPT Daily Chart (Source: Thomson Reuters)
From the chart shown, we can observe that the share price of the company underpins the movement in crude, and crude sets the price trend for the shares of the oil producer.
Latest Update:
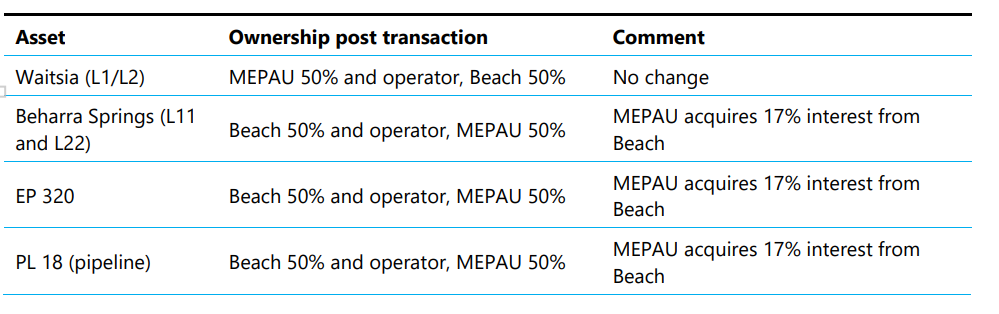
In an announcement made public by the company on 3rd July, BPT mentioned that the company executed agreements with a related body corporate of Mitsui E&P- AWE Pty Ltd, to come under a 50:50 ownership of BPTâs production licences and exploration permits in the Perth Basin.
The production licences include L11 and L22 (Beharra Springs), and the exploration permit includes EP 320 and pipeline licence PL 18 in the Perth Basin. With the agreement, the previous ownership structure of 67 per cent (BPT) and 33 per cent (MEPAU) would change to 50: 50, and BPT would retain the ownership of the permits.
The effective date of the agreement was 1st January 2019, and it is now expected to complete during the first quarter of the financial year 2020; however, the deal remains subjective over the fulfilment of various conditions including the regulatory approval.
Source: Companyâs Report
Gas Sales and Project Development:
Beach along with Joint Venture partner Mitsui E&P (MEPAU) secured a sales agreement to supply up to 20 terajoules of gas from its Waitsia Field with Alinta Energy. The contract, which would commence on 1st July 2020, has a tenure of 4.5 years.
On the development counter, the Waitsia JV permitted the expansion of the Xyris gas processing unit by 10 terajoules per day. The previous capacity of the processing plant, which stood at 10 terajoules per day, would now be expended to 20 terajoules of processing capacity per day.
BPT on Charts:
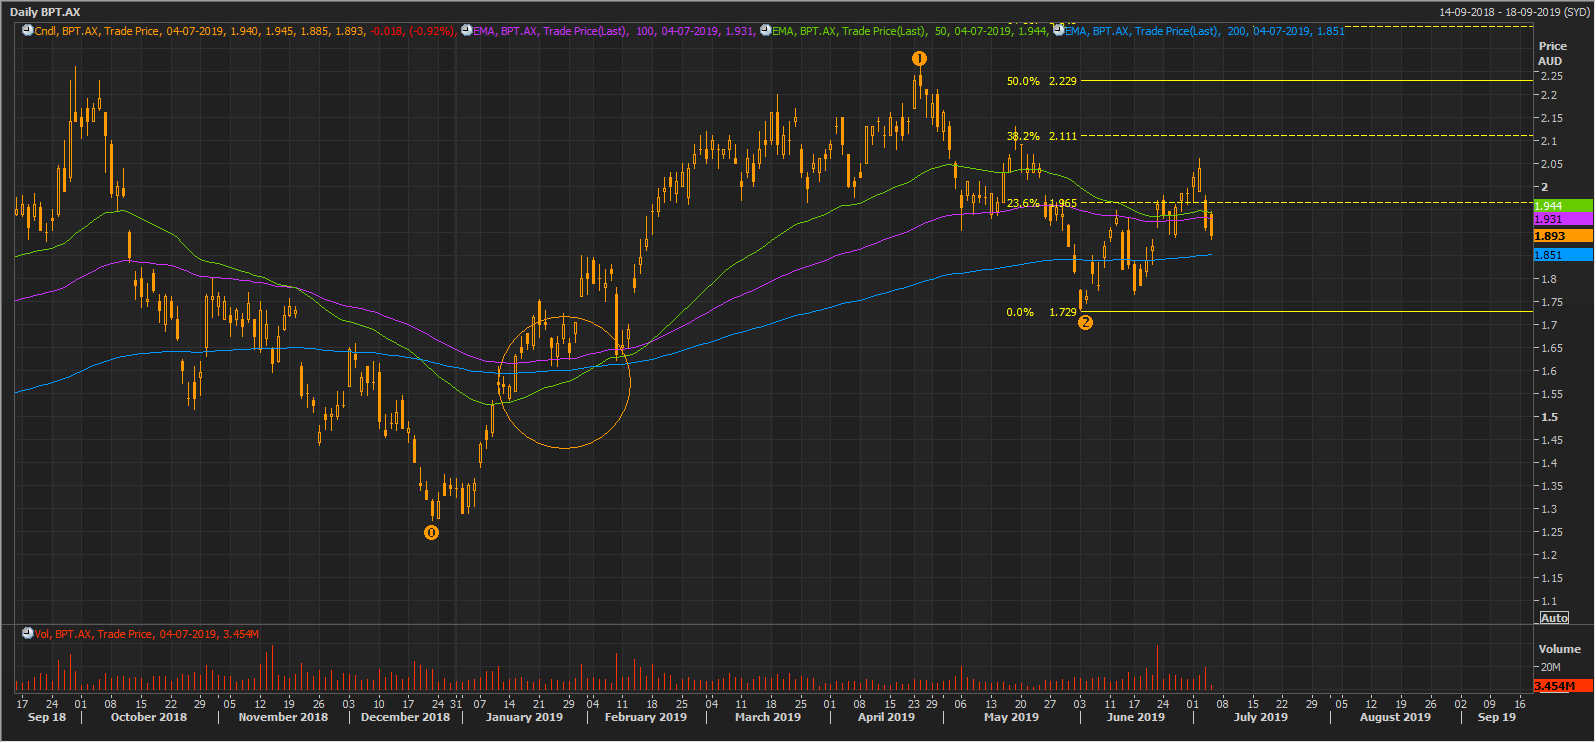
BPT Daily Chart (Source: Thomson Reuters)
On a daily chart, the share prices are moving in an uptrend, and the price actions recently witnessed a Golden Cross (bullish signal) of 200,100, and 50-days exponential moving averages. Post marking a golden cross (orange circle) the prices rallied and corrected to reach the level of A$1.729 post which the prices almost reached the 38.2 per cent level of the projected Fibonacci Series.
The recent plunge in crude exerted pressure and the shares dropped; however, the prices are taking support around its 200-days EMA, which is at A$1.851.
Disclaimer
This website is a service of Kalkine Media Pty. Ltd. A.C.N. 629 651 672. The website has been prepared for informational purposes only and is not intended to be used as a complete source of information on any particular company. Kalkine Media does not in any way endorse or recommend individuals, products or services that may be discussed on this site. Our publications are NOT a solicitation or recommendation to buy, sell or hold. We are neither licensed nor qualified to provide investment advice.
