


Oil transportation is facing a threat across the worldâs most important oil transit chokepoint- Strait of Hormuz.
The previous attacks across the Gulf of Oman and in the Fujairah, have raised serious concerns among the market participants over the maritime security and crude oil supply.
In the recent event, the attack on oil tankers in the Strait of Hormuz, which connects the Persian Gulf with the Gulf of Oman and the Arabian Sea, escalated the tension between the United States and Iran. The United States premier believes that Iran is responsible for all the recent attacks in the middle east; however, Iran refutes the claims.
The oil market is stagnant amid lesser demand forecast; however, if the global economic growth scenario improves, such events, which is threatening the supply chain could boost the prices; therefore, it is important to understand how the supply chain works, and how a disruption in it could zoom the crude oil prices.
Why is the Strait of Hormuz so Crucial?
Strait of Hormuz is one of the substantial oil chokepoints amid its large volumes of oil flows. As per the data, on an average, 21 million barrels per day or about 21 per cent of the global petroleum liquids consumption marked the transportation from the Strait of Hormuz.
As it is a major chokepoint in the oil supply, even a slight disruption along the Strait of Hormuz could lead to a significant supply delay and higher shipping cost, which in turn, could increase the volatility across the crude oil prices.
The oil flow through the Strait of Hormuz in 2018 made up about one-third of the total global seaborne traded oil after the sanctions on Iran were lifted and the production in Iran reached the pre-sanctions levels.
The oil kingpin-Saudi Arabia moves an ample amount of its crude oil and condensate through the Strait of Hormuz, and as per the United States Energy Information Administration, in 2018, 76 per cent of the crude oil and condensate that crossed the Strait of Hormuz delivered to the Asian markets.
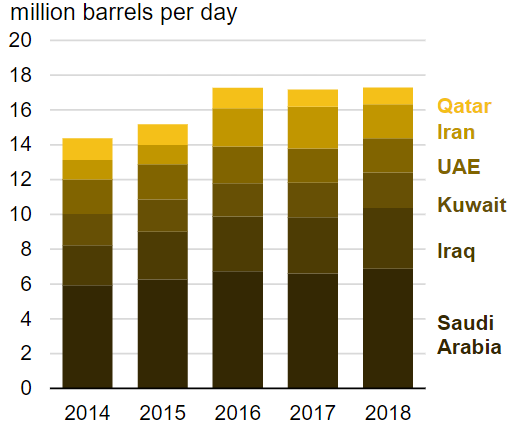
Volumes from Strait of Hormuz by origin (Source: EIA)
The Asian market is among one of the key markets for the crude oil as the crude oil demand is expected to increase in developing nations in the coming quarters, as compared to a sluggish demand forecast by the EIA for the developed markets.
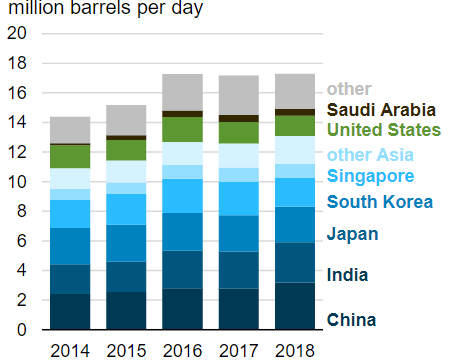
Volumes from Strait of Hormuz to the Asian markets (Source: EIA)
As the Strait of Hormuz underpins such high volume for the critical markets, a disruption in it could hinder the entire supply chain; thus, investors should monitor further events to reckon its impact on the supply chain, and in turn, the crude oil prices.
Apart from such chokepoints, the investors should pay close attention to the type of transportation vessels, which is being targeted. Not every vessel, which carries oil across the sea, is of same capacity and volume; thus, an attack on a large-capacity ship could further raise concerns of the supply disruptions.
Oil Tanker Sizes:
Under the Average Freight Rate Assessment system, which was established by Royal Dutch Shell, and the London Tanker Brokerâs Panel, the tanker vessels are classified as per the deadweight tons, which is the measure of a shipâs capacity to carry cargo. The deadweight tonnage could be changed further into the barrels equivalent by multiplying with a barrels-per-metric-ton conversion factor, which varies as per the petroleum product and crude oil amid different fuel densities.
For the shipment of Crude oil, two vessels, namely VLCC (Very Large Crude Carrier) and ULCC (Ultra Large Crude Carrier) are used. The capacity of VLCC in deadweight metric tons varies in the range of 160K-320K DWT, while the carrying capacity of ULCC varies in the range of 320k-550K DWT.
Thus, not every vessel carries same amount and value of oil, and investors should keep a track over the type of vessel, which is being targeted to gauge the overall impact of the recent attacks on the supply chain of the oil market.
Recent Attacks and the Insurance Cost:
Over the escalated tensions in the middle east and in the wake of recent attacks, the insurance cost of the ships has increased drastically. As per the data from the Nikkei Asian Review, the cost of insurance zoomed 10-fold of the original cost in the Strait of Hormuz prior to the recent attacks on the oil tankers.
The increase in the insurance cost further raised the premium on oil prices, and the Brent Crude Oil Futures on ICE surged from the level of US$59.45 (low in June 2019) to the present high of US$67.65 (Dayâs high on 11th July 2019).
The prices consolidated on 12th July and are again on an upsurge in the international market today. The prices of Brent Oil Futures on the International Commodity Exchange (ICE) are currently trading at US$66.55 (as on 16th July 2019 1:24 PM AEST).
Crude Oil Price Scenario:
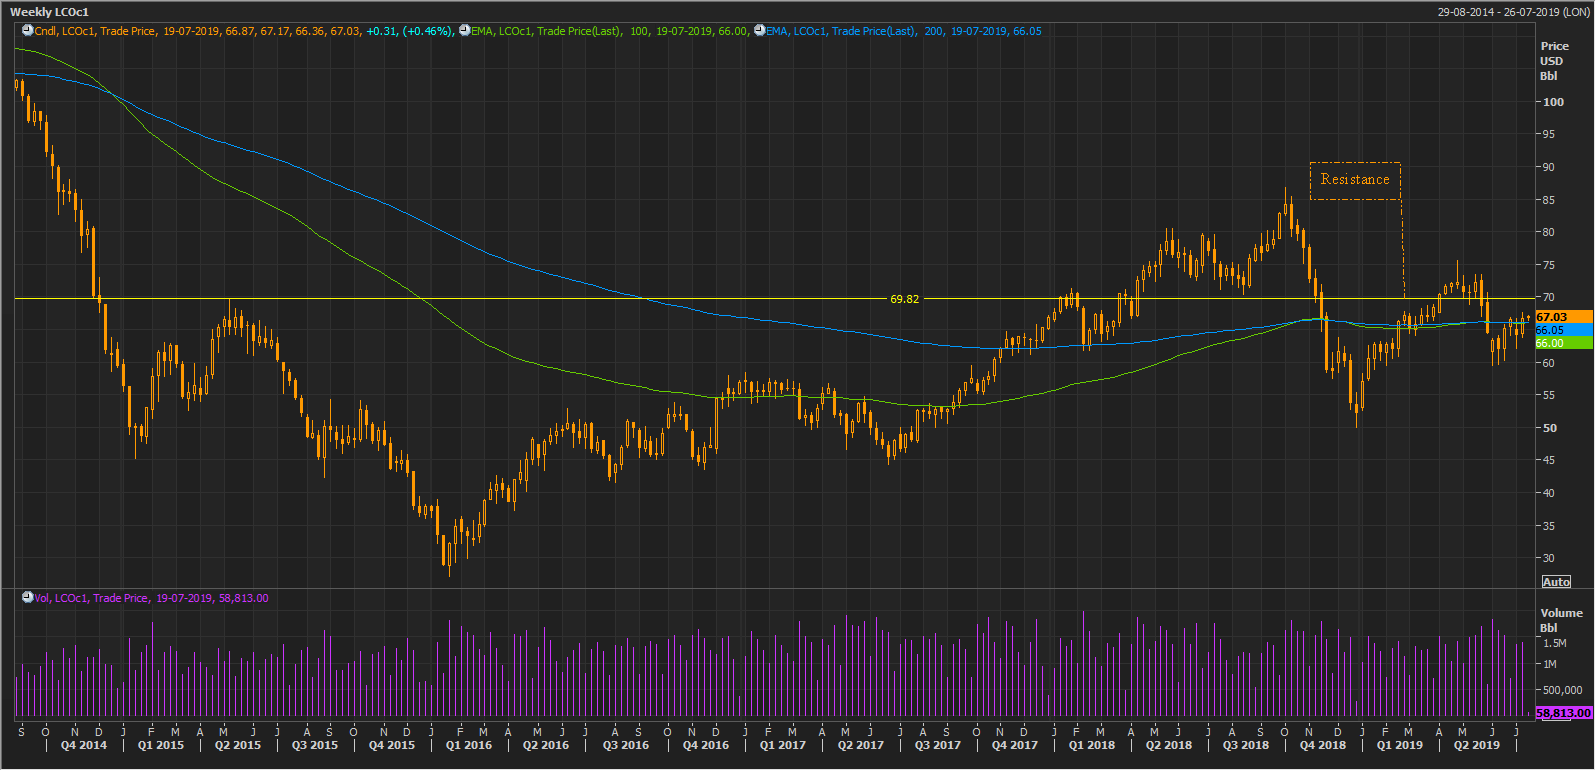 LCOc1 Weekly Charts Source (Thomson Reuters)
On a weekly chart, the crude oil prices could face resistance at the level of approx. US$70, however, the 100-days exponential moving average, which is at US$66.00 is below the 200-days exponential moving average, which is at US$66.05, which in turn, suggests that the prices could gain momentum if the prices are able to sustain a weekly close of near or above US$67.
Investors should keep a close eye around the level of US$67 as a close above the same could provide some strength to the bulls; however, the resistance is intact at US$70, and a break above US$70 or failure to do so in the coming weeks would decide further price actions in the crude oil prices.
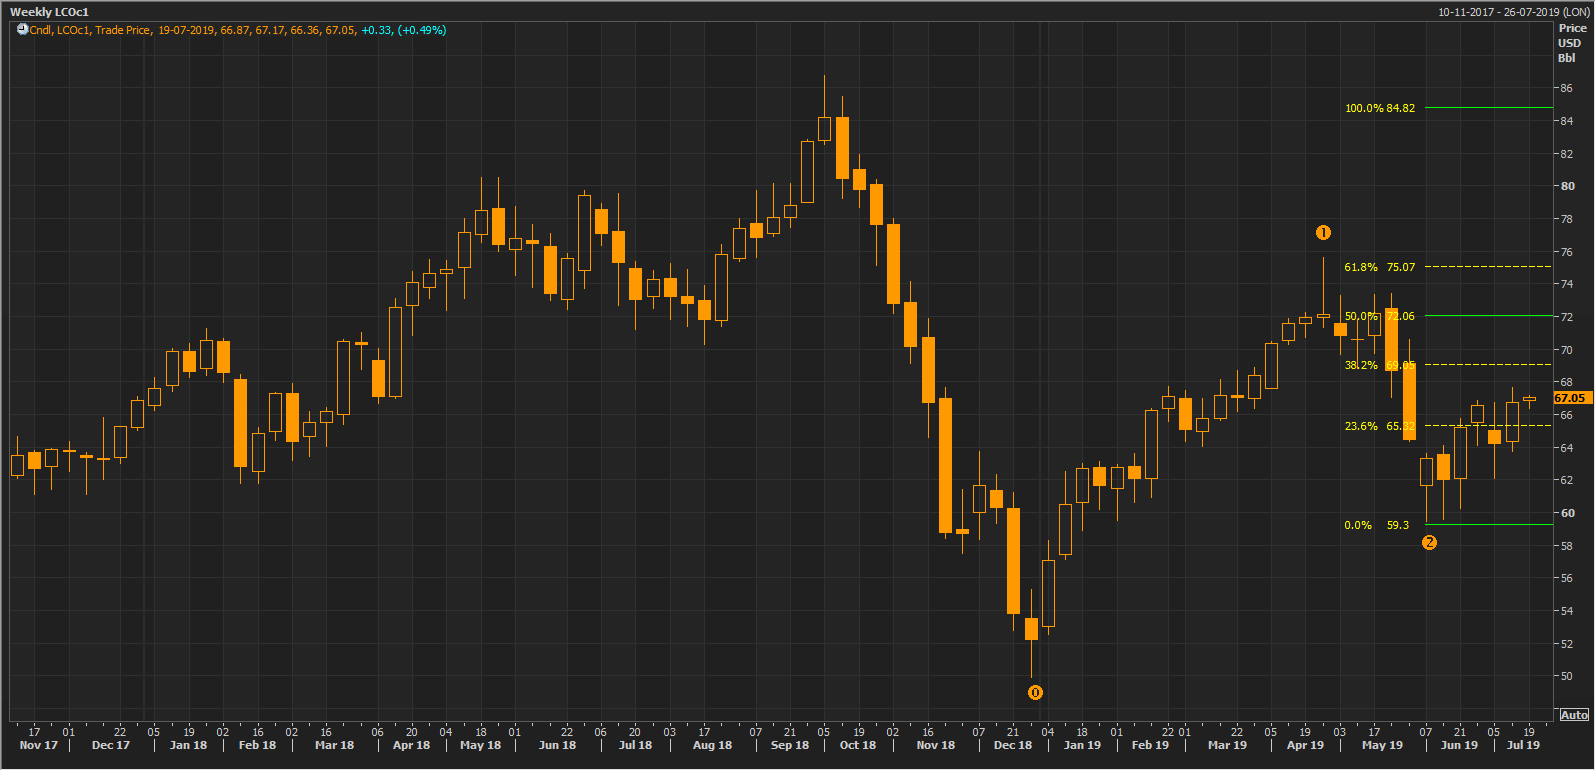 LCOc1 Weekly Charts Source (Thomson Reuters)
On further analysing the weekly chart further, the Fibonacci Series could be projected from the points marked as 0,1,2 on the chart shown above. On connecting the Fibonacci, we can observe that the immediate resistance is coming at the 38.2 per cent projected level, which is at US$69.05.
In a nutshell, on a weekly chart, investors should monitor the range from US$67-US$70, as this could be the range, which could offer immediate resistance to the crude oil prices.
Crude on a Daily Chart:
 LCOc1 Daily Charts Source (Thomson Reuters)
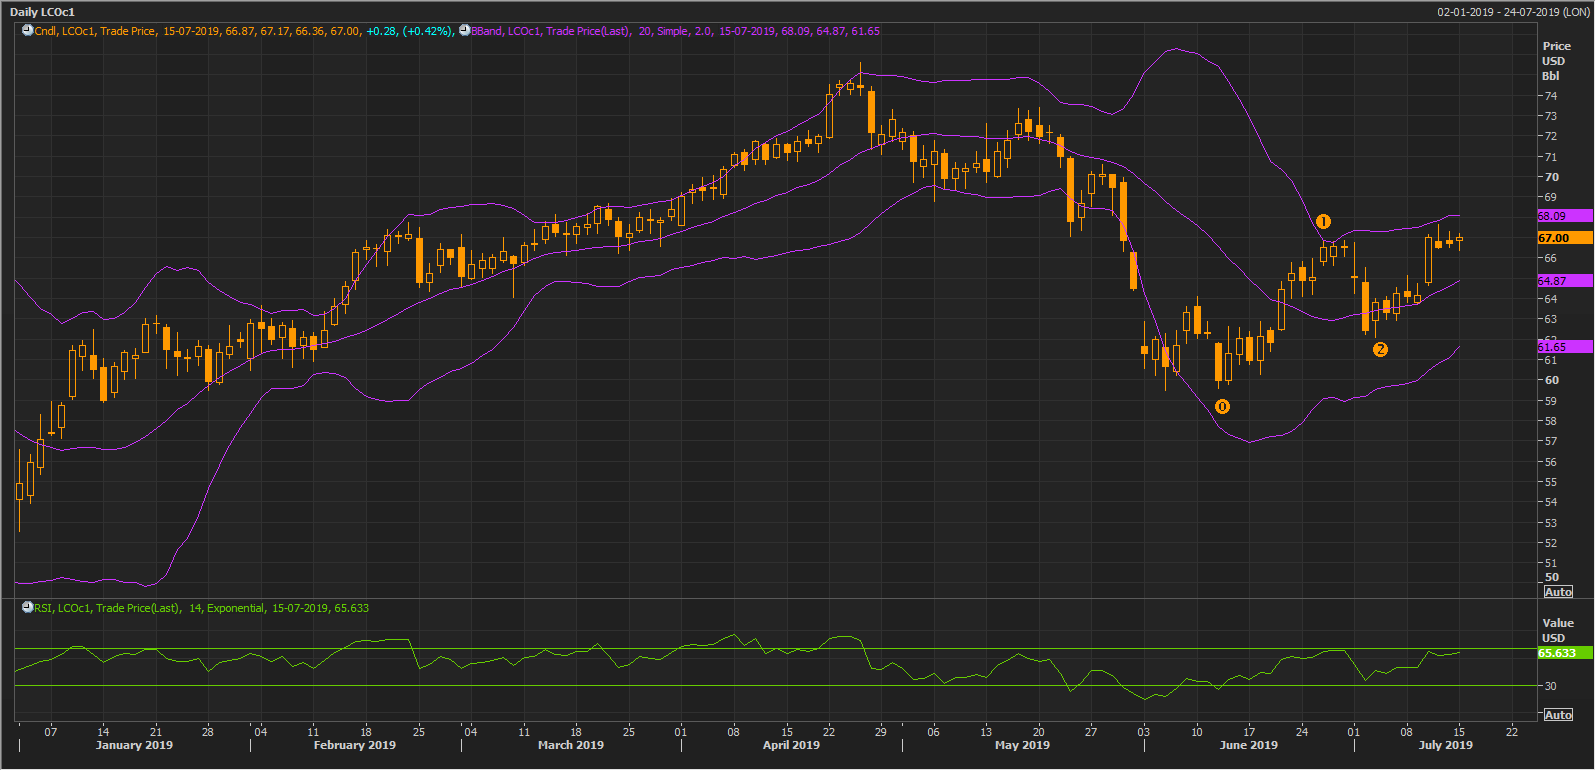
On a daily, chart, the crude oil prices are trading above the median of 20-days simple Bollinger Band, and in the past few trading sessions, the crude oil prices have faced hurdle at the twice of the Standard Deviation (the upper band) from the 20-days simple moving average median, which is US$68.09.
On the technical indication front, the 14-days Relative Strength Index is moving in tandem with the crude oil prices.
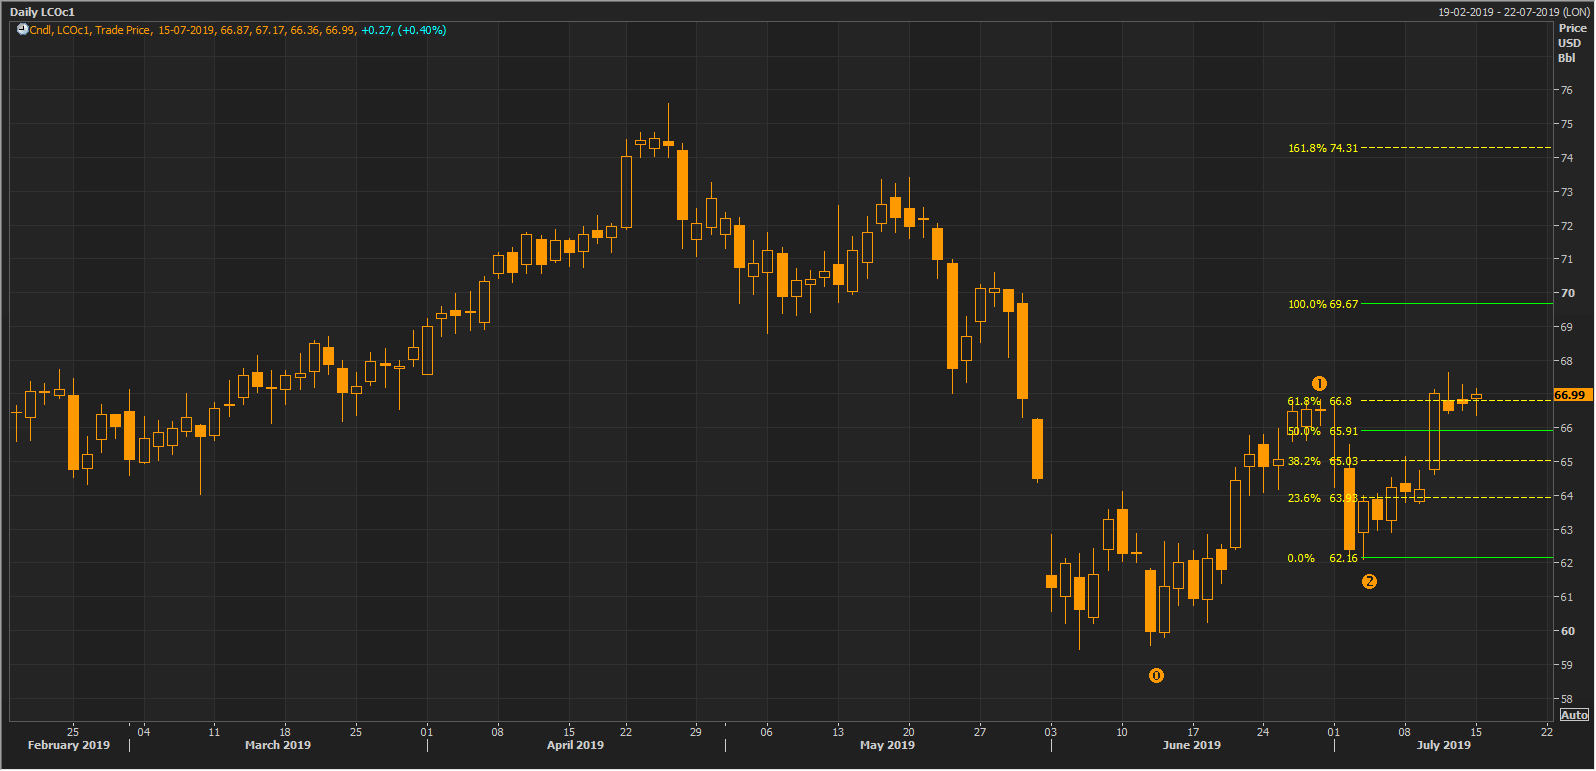
On further analysing the daily chart, one can notice, that the Fibonacci Series could be projected from the points marked as 0,1,2 on the chart shown below.
 LCOc1 Daily Charts Source (Thomson Reuters)
On further extending the Fibonacci Projections, we can see that the prices have already breached the level of 61.8 per cent projected level, which is at US$66.8. The Fibonacci projected revealed the immediate support of the crude oil at 50.0 per cent, which is at US$65.91.
The upside hurdle is intact on the daily chart at US$69.97, which is in line with the resistance on the weekly chart.
The Current Scenario:
In the current scenario, the United States Energy Information Administration anticipates, that the crude oil prices would average around US$70 a barrel in 2019 amid week global economic conditions, which in turn, could hamper the demand.
Over the weak demand scenario, Russia and the OPEC cartel have decided to curb the crude oil output to support the prices; however, the rising exports from the United States are off-setting the OPEC and Russia stance, which in turn, is balancing the prices in the international market.
If the recent attacks on oil tankers repeat, it could possibly raise the premium on crude oil prices, and investors should monitor the development in the middle east and tensions between the United States and Iran to reckon the future price movement completely.
Disclaimer
This website is a service of Kalkine Media Pty. Ltd. A.C.N. 629 651 672. The website has been prepared for informational purposes only and is not intended to be used as a complete source of information on any particular company. Kalkine Media does not in any way endorse or recommend individuals, products or services that may be discussed on this site. Our publications are NOT a solicitation or recommendation to buy, sell or hold. We are neither licensed nor qualified to provide investment advice.
