
 AUS
AUS
 NZ
NZ
 UK
UK
 CA
CA
 USA
USA
 IND
IND








Origin Energy witnessed a strong performance in FY2019 which ended on 30 June 2019. The company reported a 36 per cent increase in commodity revenue as the international commodity markets knocked the heaven doors at the beginning of the year 2019.
Crude oil, which is a significant part of ORGâs product portfolio, surged in the first quarter of the year 2019 to the level of US$68.97 (March High) before finally touching the 2019 high level of US$75.72.
In the first quarter of the year 2019, crude oil prices supported by global tensions and supply shortage over OPEC voluntary production cut underpinned the growth of over 36 per cent.
The higher commodity prices in the international market helped Origin in reaping net cash of A$943 million from its 35 per cent owned Australia Pacific LNG venture (or APLNG) in Queensland.
The net cash of A$943 million from the APLNG venture underpinned the growth of 160 per cent in the net cash as compared to the previous financial year net cash of just A$363 million. A 36 per cent gain in the oil prices supported a 36 per cent growth in the commodity revenue for FY2019, which stood at A$2,788.6 million.
Now, the question which arises in the investorâs mind is, what would the company do with high net cash?
The market participants are expecting that the high net cash from the Australian Pacific LNG operations would now deviate towards the dividend post a two-year hiatus despite beleaguered conditions for the core energy markets business (Electricity and Gas business).
Debt Vs Dividend:
Origin is consistently drawing down its debt or deleveraging its position in the market post- FY2015.
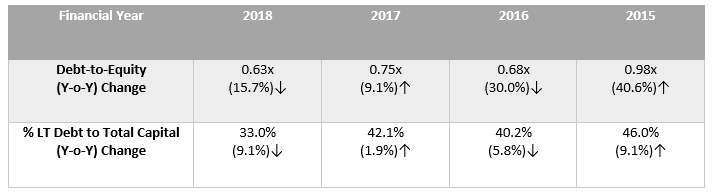
Deleverage (Source: Thomson Reuters):
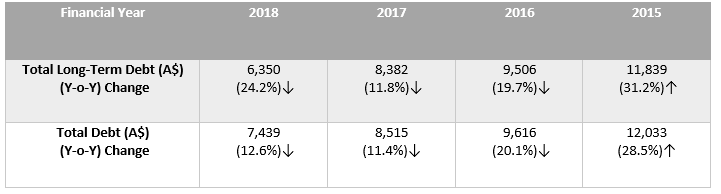
Debt Profile (Source: Thomson Reuters):
Origin has drawn down over 38 per cent of its total debt since the total debt ballooned approx. A$12 billion in 2015, which in turn, raised high hopes among the market participants for a high dividend this year. The company jettisoned the dividend in FY2017 and FY2018 and focused on deleveraging.
However, post a two-year hiatus, ORG distributed or paid a fully franked dividend of 10 cents per share in the first half of the financial year 2019.

Dividend Yield (Source: Thomson Reuters):
The FY2019 dividend yield delivered by the shares of the company stands at 1.26 per cent as per the current closing of A$7.850.
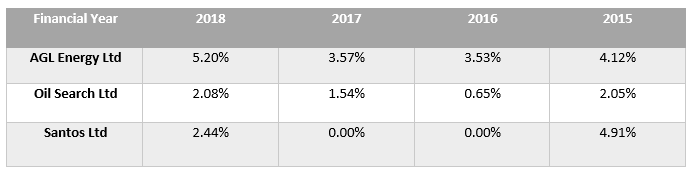
Peer Dividend Yields (Source: Thomson Reuters):
While Origin dropped the dividend, the peer groups are delivering decent dividend yields for quite some time, and the company could experience the peer pressure, albeit not mandatory. However, this could prompt the company to distribute some dividends.
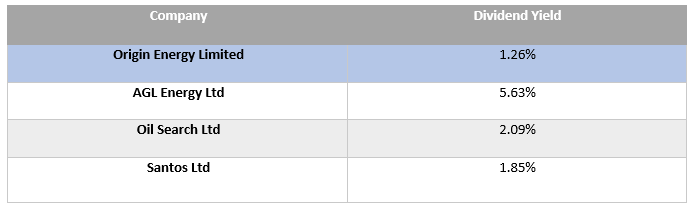
Current Yield (Source: ASX):
The current yields of the peer group are also higher than ORG, which in turn, could prompt the energy explorer to pay dividends to match the peer group in terms of return profile.
How Did ORG Perform?
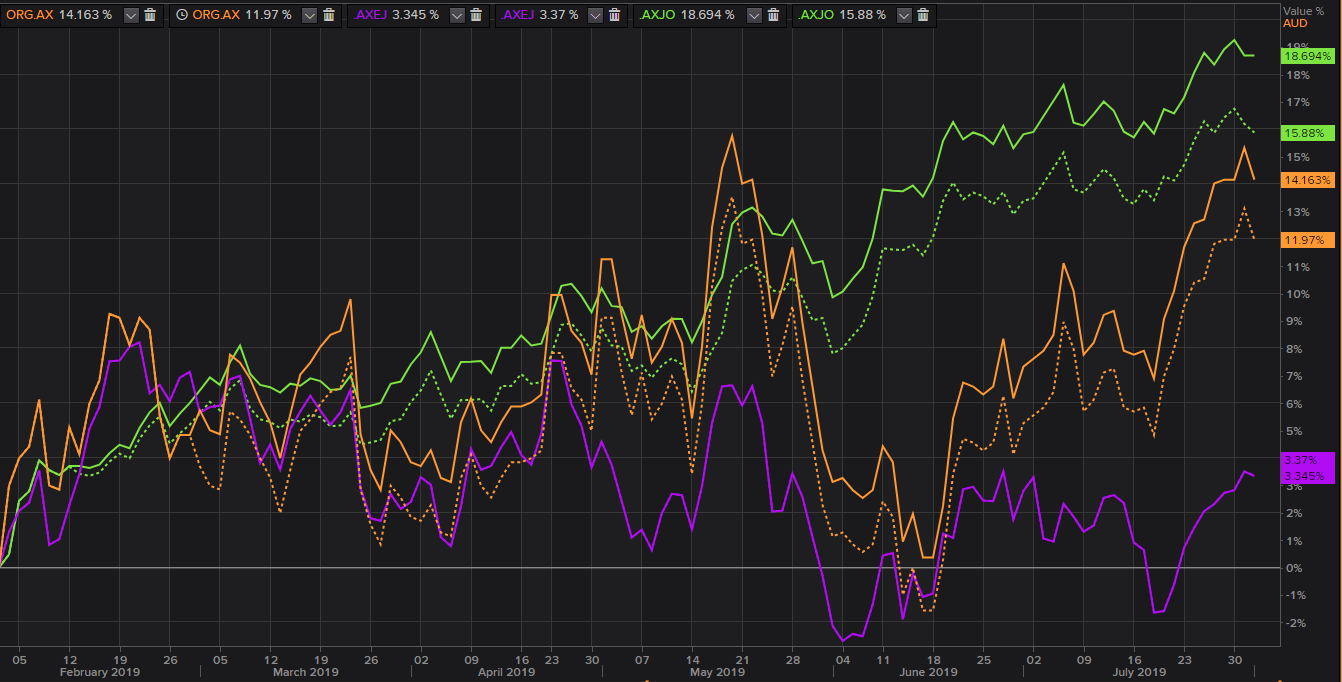
Bold line-Total Returns and Dotted Line-Absolute Price Change Returns (Source: Thomson Reuters)
As compared to the S&P/ASX 200 Energy Index, the shares of the company delivered a total return of 14.163% over the last six months and outperformed the energy index. However, the stock lagged the S&P/ ASX 200 Index over the last six months, which delivered a total return of 18.694 per cent.
Peer Group:
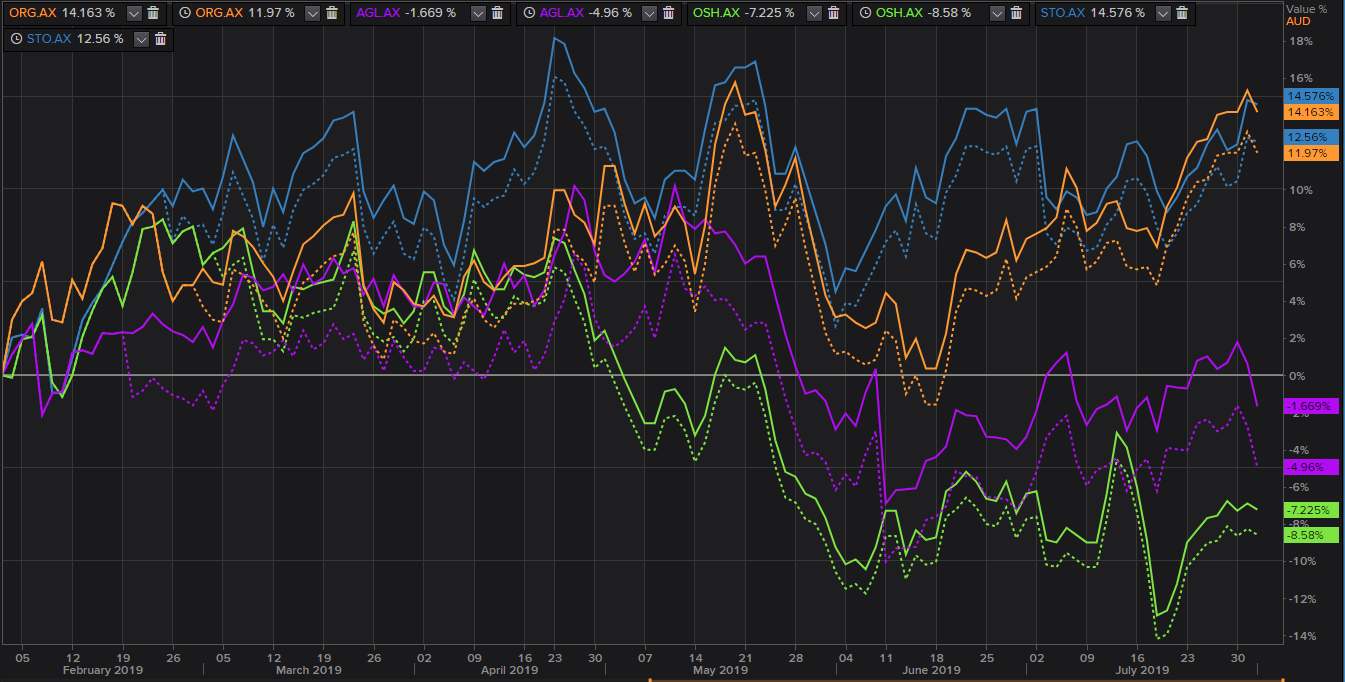
Bold line-Total Returns and Dotted Line-Absolute Price Change Returns (Source: Thomson Reuters)
Despite a lower dividend yield, ORG outperformed the peer group over the last six-months. From the chart shown above, we can see that the returns from the company are moving neck-to-neck with the return from Santos Limited (ASX: STO) and clearly outperformed the other companies taken in the comparison.
ORG On Charts:
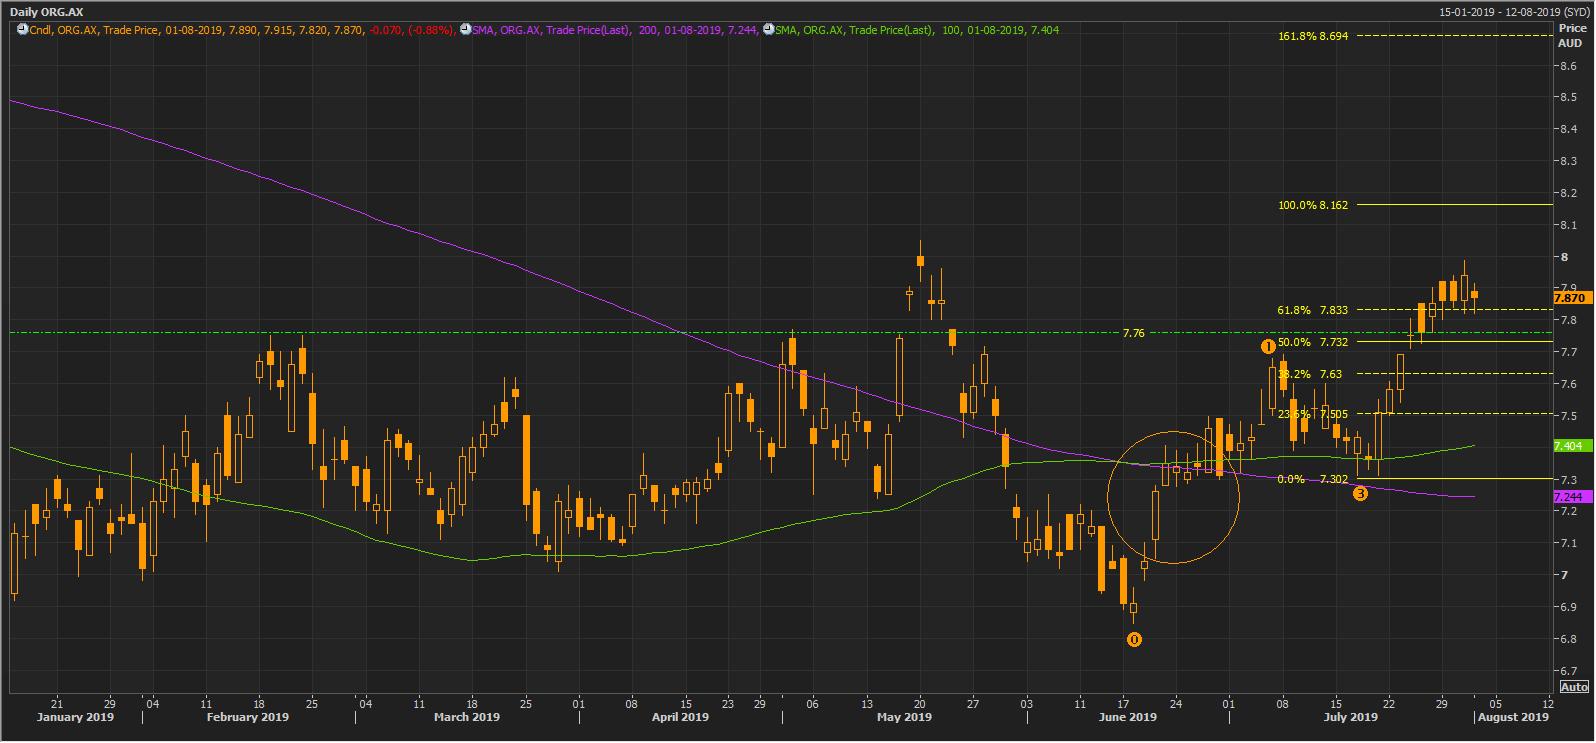
ORG Daily Chart (Source: Thomson Reuters)
On a daily chart, the share prices of the company crossed its initial hurdle of A$7.76 post witnessing a Golden Cross, which is a bullish signal, of 200 and 100-days simple moving averages marked with an orange circle on the chart shown above.
Post witnessing the cross the prices crossed the mark of A$7.76, which could now act as the near-term support to the share prices of the company. If the company decides to distribute dividends in the coming quarters, the level of A$7.76 would be worth monitoring.
When projected by the Fibonacci Series on a daily chart, connected through the points marked as 0,1,2 on the chart shown above, we observed that the share prices of the company crossed the 61.8 per cent level of the projection, which was at A$7.833, which in turn, could act as the immediate support for the share prices of the company.
The 100.0 per cent projected level of the series is at A$8.162, which could be the next hurdle to the share prices for the company, and investors should closely monitor the level as a break above or failure to do so would decide further price actions.
Disclaimer
This website is a service of Kalkine Media Pty. Ltd. A.C.N. 629 651 672. The website has been prepared for informational purposes only and is not intended to be used as a complete source of information on any particular company. Kalkine Media does not in any way endorse or recommend individuals, products or services that may be discussed on this site. Our publications are NOT a solicitation or recommendation to buy, sell or hold. We are neither licensed nor qualified to provide investment advice.
