


Equity markets are one of the most lucrative investment avenues with higher risks. Entry and exits points are the most important determining aspects for a profitable equity portfolio.
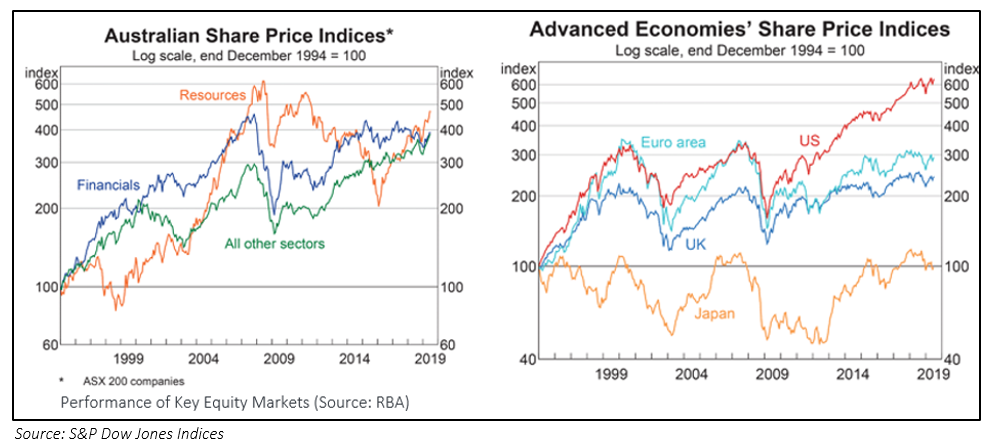
Global equity markets have performed strong so far in 2019, so as Australian equity markets ; U.S. equites have seen a rally of ~20.1% whereas Australian equities have rallied by ~20.49% as on 12 July 2019, Friday.
Looking back to past 12 months performance, the markets have seen rollercoaster ride in 2018. The month of February saw resentment, driven by concerns due to US Federal Reserve hiking interest rates. These concerns led to a sharp fall in the global equities from its highs in the month of August-September, with US equites and Australian equities falling significantly. Aggressive policy stance by US Federal Reserve, US-China Trade War, economy of China slowing down, partial US Government Shutdown were the major culprits behind this sharp fall.
After factoring in all these hiccups, the global equity markets bounced back in the first quarter of 2019, despite continued trade concerns. The period saw the stimulus measures to boost the China economy and central banks easing the policy stances.
As a market phenomenon, trend in the equity markets in terms of correction or rally tends to change and neither is sustainable for short to medium. Every correction is followed by a rally (short-term or medium-term), and vice versa each uptrend is interrupted by a correction eventually; the associated volume and time frame are significant are key determinants of direction of market.
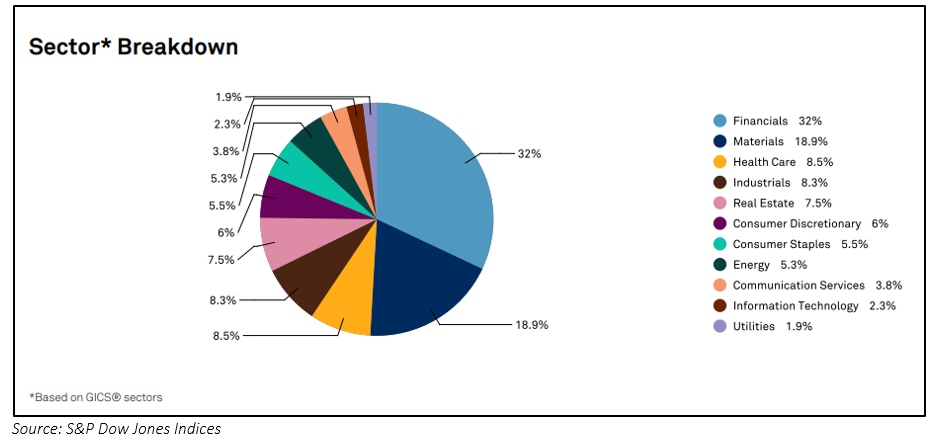
Fundamentals of Indices: Market participants observe various measures and valuations to assess the performance of the market, to build an outlook and trade accordingly. We need to understand the sector wise index valuation to assess the performance and fundamentals of the overall market. The below discussed valuation of the indices are as per the fact sheet released on 28 June 2019 by S&P Dow Jones Indices LLC.
S&P/ASX 200 Index is trading at trailing price to earnings multiple of 17.45x with projected price to earnings of 16.74x, as of 28 June 2019. At current level, the index is trading at 1.83x of its book, 2.18x of its sales, and 13.7x. of its cash flow.
S&P/ASX 200 Consumer Discretionary Indexâs trailing price to earnings for the index is at 18.99x with projected price to earnings at 19.94x. The index is available at the price to book multiple of 2.24x, price to sales of 1.09x and price to cash flow of 12.84x. Indicated Dividend Yield for the index stood at 4.44%.
S&P/ASX 200 Energy Index has given total returns of 15.04% on YTD. On valuation metrics front, the index is trading at trailing price to earnings of 14.96x with projected price to earnings of 13.53x. Multiples such as price to book, price to sales and price to cash flow came in at 1.43x, 1.41x and 8.13x, respectively. Indicated dividend yield stood at 4.57%.
S&P/ASX 200 Health Care Index has generated a total return of 17.62% on YTD basis. The index is trading at trailing price to earnings of 31.79x and projected price to earnings of 28.23x. The Price to book, price to sales and price to cash flow multiple for the index stood at 6.75x, 3.75x and 24.98x, respectively. The index comprises fourteen constituents.
S&P/ASX 200 Industrials Index is available at the trailing price to earnings of 31.9x with projected price to earnings of 27.41x. The price to book multiple came in at 3.97x with price to sales multiple at 2.38x and price to cash flow multiple at 12.36x. Indicated dividend yield for the index stood at 3.49% with total returns of 21.23% on YTD basis.
S&P/ASX 200 Information Technology Index generated total returns of 25.46% on YTD basis. The index is trading at trailing price to earnings of 40.88x and projected price to earnings of 39.16x. The Price to book multiple comes in at 6.66x with price to sales and price to cash flow multiple of 6.35x and 32.31x, respectively. Indicated dividend yield for the index stood at 1.25%.
S&P/ASX 200 Materials Index has given a total return of 26.62% on YTD basis and is currently trading at trailing price to earnings of 15.65x and projected price to earnings of 13.84x. The Price to book, price to sales and price to cash flow multiple stood at 1.46x, 1.49x and 5.55x, respectively.
S&P/ASX 200 Financials Index is available at the 15.35 of its trailing earnings with projected price to earnings at 14.6x. The index is trading at 1.68x of book multiples, 5.73x of its sales and -469.63x of its cash flow multiples. Indicated dividend yield stood at 5.36% at the end of the period. The index has given total returns of 17.49% on YTD basis.
S&P/ASX 200 Resources Index has given a total return of ~25.23% on YTD basis. The index is available at the trailing price to earnings of 14.37x with projected price to earnings of 13.46x. The index is trading at 1.36 times of its book, 1.55 times of sales and 5.46 times of its cash flow. Indicated dividend yield stood at 3.75a%.
Apart from sectoral indices, it is important to understand the various macro aspects to gauze the behaviour of the market:
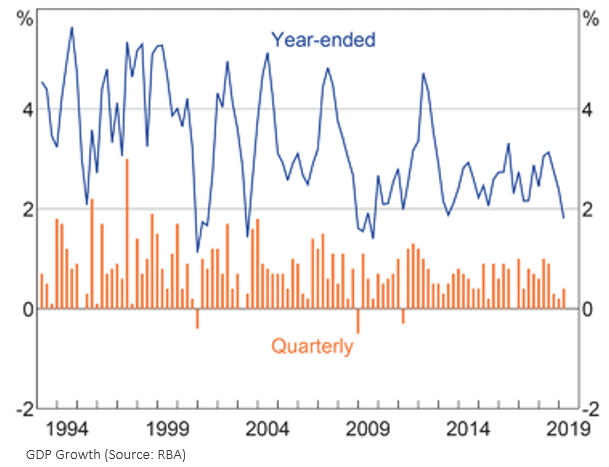
Growth of the Economy: As per RBAâs Statement on Monetary Policy â May 2019, GDP growth for the Australian economy has remained low with subdued household income and the adjustment in the housing market which affected the spending pattern of consumers. GDP growth is projected to be approximately 2¾% in 2019 and 2020, driven by revised outlook for household consumption spending and dwelling activity. The weaker economic growth is likely to receive boost from new mining investment projects and higher export numbers. Robust growth in public demand in recent quarters, investments for non-mining business picking up, steady employment at 5% since last few quarters, positive indications from labour market with higher employment growth and vacancy rate, strong taxation revenue, etc might signify the weak economic growth to bottom out.
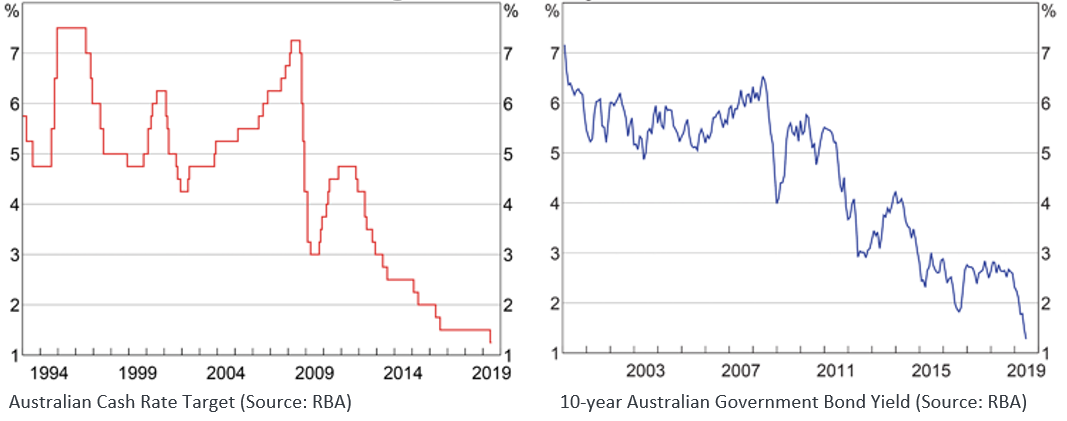
Inflation and Interest Rates: Australian economy has seen a significant lower inflation rate with underlying inflation below than expectation at 1½% over the year to March quarter and is expected to remain low in coming quarters due to weakness in housing-related items. The RBA expects headline inflation to get a boost in the June quarter, driven by the hike in petrol prices. Trimmed mean inflation is projected to come at 1¾% over 2019 and estimated to move upward to 2% in 2020, and further reaching to >2% level in the early 2021.
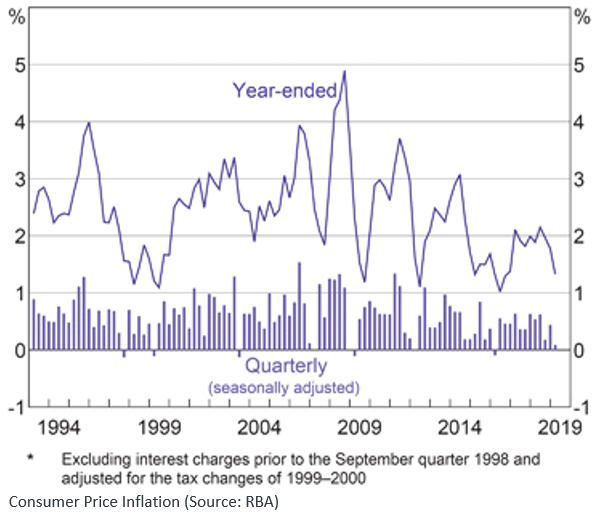
The RBA has slashed down the rate in back to back cut since the European bank crisis in 2012 and had maintained the cash rate at 1½% since August 2016. The interest rate cycle has been on reversal since the high of 4.75% in November 2011. However, it was further cut to an historic low of 1% on the back of rising unemployment and slower growth of the economy. Although, the lower interest rates are a matter of concern for Australian economy, the phenomenon is globally prevailed.
Given the falling interest rate regime, Australian investors are flocking to equity markets.
Disclaimer
This website is a service of Kalkine Media Pty. Ltd. A.C.N. 629 651 672. The website has been prepared for informational purposes only and is not intended to be used as a complete source of information on any particular company. Kalkine Media does not in any way endorse or recommend individuals, products or services that may be discussed on this site. Our publications are NOT a solicitation or recommendation to buy, sell or hold. We are neither licensed nor qualified to provide investment advice.
