


_07_02_2025_00_23_12_199043.jpg)

The Australian Securities Exchange (particularly the S&P/ASX 200 index) successfully found a hot spot amid global stock exchanges last week, after the overall market finally surpassed the nervous bar of 7,000 points for the first time ever. With almost all the sectors trading high, the benchmark index witnessed a surge of almost 6% (YTD).
So, what propelled this record streak? The main driver could possibly be firstly the likelihood and later the actual signing of the Phase One trade deal truce between the US and China on 16 January 2020. This kindled renewed hopes of an expected end to the prolonged trade war between the world’s two largest economies.
Consequently, demand for risky assets increased, tariffs were rolled back and there was again a boost in the Chinese purchases of certain American goods, after a very long time. Investor sentiment in such times of an expected economic stability is therefore, expected to be on the positive end.
The International Monetary Fund (IMF) believes that the Phase I deal, if durable, can alone shun the cumulative negative impact of trade tensions on the global GDP by this year’s end, from 0.8 per cent to 0.5 per cent.
Tables Turn- What’s Lowering Investor Sentiment?
However, the Australian benchmark index S&P/ASX 200 appeared determined to conclude its gaining speed on 21 January 2020, as by lunch time, the index declined by 0.3 per cent to reach 7,059.7 points.
So, what has triggered this turn of events? Experts believe the main prompt for the downturn is IMF’s recently released global economic outlook. The report states that the global outlook is likely to remain sluggish.
The organisation, that aims to foster global monetary cooperation and financial stability around the world, believes that global growth will increase moderately from 2.9 per cent in 2019 to 3.3 per cent in 2020 and 3.4 per cent in 2021. What might have made investors skeptical is the projection that recovery for global growth remains uncertain.
ASX Stocks Inch Lower
Discussing the benchmark index S&P/ASX 200 again, which continued to drop post lunch on 21 January 2020, and was down 32.5 points to 7047, a fall of nearly 0.46 per cent. The highlights have been one of the Big Four- Commonwealth Bank (ASX:CBA), mining giant BHP Group Limited (ASX:BHP), Sydney Airport (ASX:SYD) and Lendlease Group (ASX:LLC), to name a few, all trading in red.
With the ASX 200 (which primarily comprises of blue chips) trading in red makes one believe that even when the benchmark index is at record highs, investors sentiment, being vulnerable, might make market moves interesting in the coming weeks.
Are ASX Bluechips Expensive?
On the other side, there have been speculation that the ASX has one of the most expensive blue-chip stocks in the world, if one excludes the materials and financial sectors. The consensus believes the blue-chip industrial stocks, healthcare stocks and the technology stocks are quite expensive, compared to other benchmark indices in the world.
How true is this? Let’s understand seeing the below two examples-
ASX Blue Chip Woolworths Group Vs Global Magnate Walmart
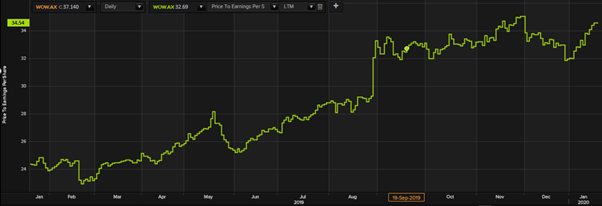
P/E Ratio of Woolsworth (Source: TR)

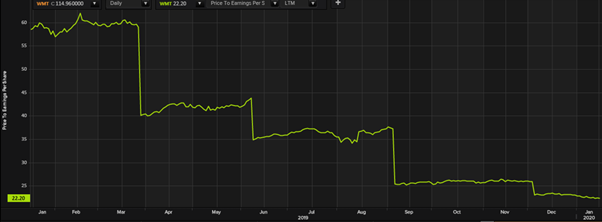
P/E Ratio of Walmart (Source: TR)
As evident from the above two graphs, WOW has become relatively expensive over the last one-year period when compared to Walmart, a business in the same industry on a global level. Despite the global downturn and slumped economic market that engulfed stock exchanges alike, ASX-listed WOW seems to have been on a bull-run with returns of over 31% in the last one year, as against Walmart which has delivered returns of approximately 18%.
As per data from Thomson Reuters, WOW is available at a P/E of 34.54x whereas Walmart is available at a P/E of 22.2x (as on 21 January 2020).
Let’s take another example to justify our case scenario-
ASX Blue chip CSL Limited Vs Amgen Inc
P/E Ratio of CSL (Source: TR)
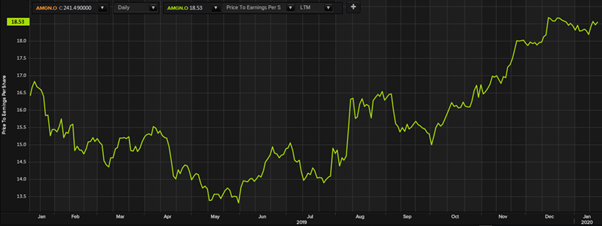
P/E Ratio of Amgen Inc (Source: TR)
ASX-listed CSL Limited is currently available at a P/E ratio of 49.36x (as on 21 January 2020) and it’s stock price has increased by almost 55% in the past one year. Its global peer, Amgen Inc. from the Biotech space has had few twirl winds over the year and has relatively underperformed with returns of 18% in the past one year, compared to CSL. Amgen is currently available at a P/E Ratio of 18.53x (as on 21 January 2020)
As witnessed in the above two examples, ASX-listed blue chips are trading at much higher valuations than their global peers. However, the stock market is highly dynamic and trend changes are likely to alter with each day and every economic activity that impacts global businesses.
However, market experts vouch that the market tends to value good businesses at higher multiples. To make a blanket call and infer market trends is futile.
ASX at Market Close
On 21 January 2020, the S&P/ASX 200 index closed marginally lower, down by 13.2 points or 0.19 per cent at 7066.3 points relative to the last close.
