


The Brent crude oil markets across the globe have shown a lot of turbulence in the recent few months over the geopolitical factors. The Aramco incident on September 14 initiated a significant spike in oil prices across the global market by disrupting about 5 per cent of the global liquid fuels supply.
To Know More about How Crude Reacted in the Wake of Aramco Fire, Do READ: Aramco Fire Fuelled ASX Energy Stocks; United States SPR to Rebalance the Supply Chain?
However, Aramco restored most of its operational capacity at the Abqaiq crude oil processing facilities post the incident in few weeks, and also supported the demand from customers by selling oil from the inventories and reducing domestic oil inputs into refineries.
Meanwhile, the United States exported large volume of crude oil in the international market, which in turn, brought the crude oil prices back to the normative state, and the prices returned to the pre-attack levels by early October 2019.
The front-month Brent oil futures settled USD 0.55 lower in October 2019 at USD 57.71 a barrel against the September futures settlement price, as the market adapted fairly smoothly to the supply disruption.
The United States Energy Information Administration (or EIA) estimated that the attack on the Aramco crude oil processing facilities reduced Saudi Arabiaâs crude oil production by 1.4 million barrels a day in September, as compared to the production of 9.9 million barrels a day in August 2019.
The EIA also anticipates that the attack decreased the overall OPECâs spare production capacity by 1 million barrel a day as Saudi Arabia holds the majority of OPECâs spare crude oil production capacity, and the same is forecasted to reach to the pre-attack levels by January 2020.
How did the Long-Term Futures Behave in the Wake of Saudi Attack?
The crude oil longer-dated contracts of the futures curve increased slightly in proportional to the gain in short-term contracts. However, the longer-dated contracts considered the building global oil inventory and the level of backwardation remained intact with Brent futures for 2020 and later declining to levels lower than the pre-attack prices.
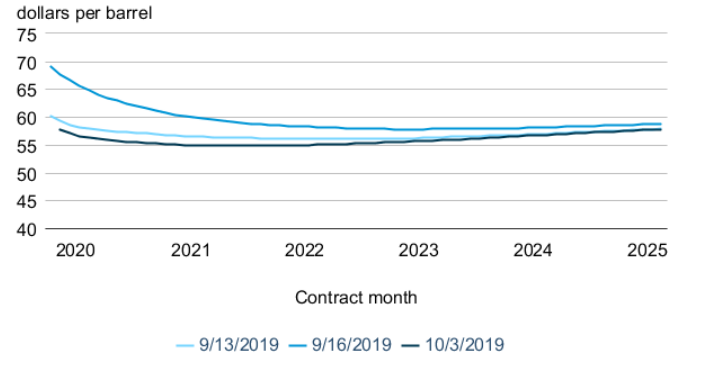
Brent Oil Future Curves (Source: EIA)
The possible hedge from the crude oil supplier might have exerted further selling pressure on the crude oil future curve of longer-dated expiry, and they remained low, representing a negative outlook for the oil prices.
However, the recent future curve is showing an upward swing, with December expiry trading above its precedent expiry on the International Commodity Exchange, representing a positive outlook for the second half of the year 2020.
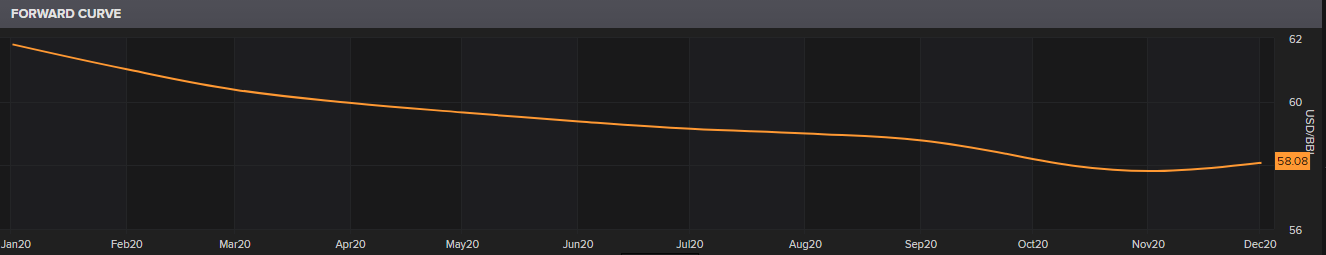
LCO Future Curve (Source: Thomson Reuters)
To Know More About the Relevance of the Future Curve in Understanding the Demand And Supply Dynamics, Do Read: An Investorsâ Guide for Commodity Valuation and Mining Stocks
EIA Estimations for Oil Markets
EIA anticipates an average build of 0.3 million barrels per day across the global liquid fuels inventories as non-OPEC supply chain grows in 2020, which was previously predicted by the EIA in their modelled reference case.
To Know More About the Modelled Reference Case, and Growth of Oil Production and Energy Consumption in Non-OPEC Countries, we encourage you to READ: EIA Modelled Reference Case Forecast; Non-OECD Nations To Witness Higher Energy Consumption
The Brent crude oil spot prices are estimated by the EIA to average at USD 59 a barrel in the fourth quarter of the year 2019.
The chain of downgrading the average Brent crude oil prices by the EIA for the second half of the year 2019 continues with the present forecast.
To Know More, Do Give a Look at the Previous Forecast, and try to Capture the Shift in the global oil production trend. READ: EIA Forecast Brings More Shock Waves For ASX-listed Oil & Gas Explorers
The EIA predicts that the Brent Crude prices would average USD 60 a barrel in 2020 with an average price of USD 62 per barrel during the second half of the year 2020, and an average price of USD 57 a barrel in the second quarter of the year 2020.
Supply Disruption Indication
Crude oil implied volatility index is a suitable measure to gauge the supply side of the global oil market. While the crude oil prices and implied volatility typically exhibit negative correlation, at the time of supply disruption, the correlation between the oil prices and implied volatility shifts to exhibit positive correlation.
At the time of supply disruption, the market looks for an alternative source of supply, which contributes to the higher bidding from the potential buyers, which in turn, increases both price and implied volatility.
Also Read: Commodity Indices-Pulse to Reckon the Global Economic Conditions?
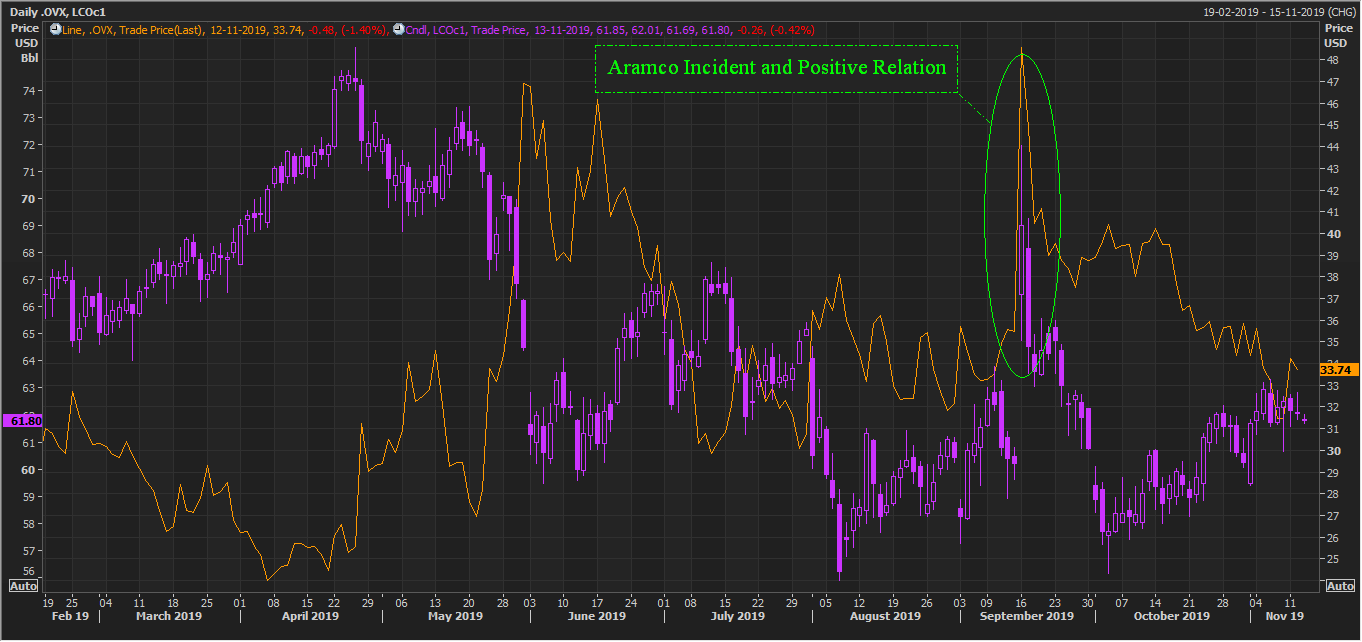
OVX and LCO Daily Chart (Source: Thomson Reuters)
It could be depicted from the above chart, that the implied volatility (representing by the line) and the oil prices (representing by the candlesticks) exhibit negative correlation. However, during the Aramco attack, both the prices and the implied volatility skyrocketed together over the supply worries.
However, post spiking both prices and the implied volatility retraced down as the market reckoned the impact of the Aramco incident on the global supply chain and demand, and the global production returning back to the normal levels.
OPEC and the United States Oil Production
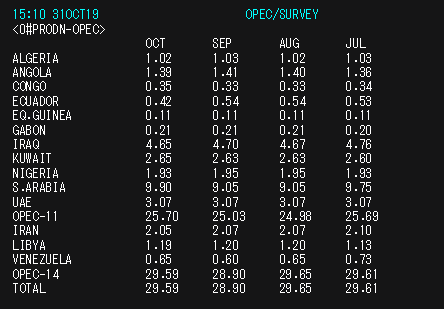
OPEC Oil Survey (Source: Thomson Reuters)
The oil production in October 2019 across the OPEC nations improved by 0.69 million barrels a day, and the total OEPC production stood at 29.59 million barrels a day in October, which in turn, further suggested on the OPECâs capability of quickly restoring the supply chain.
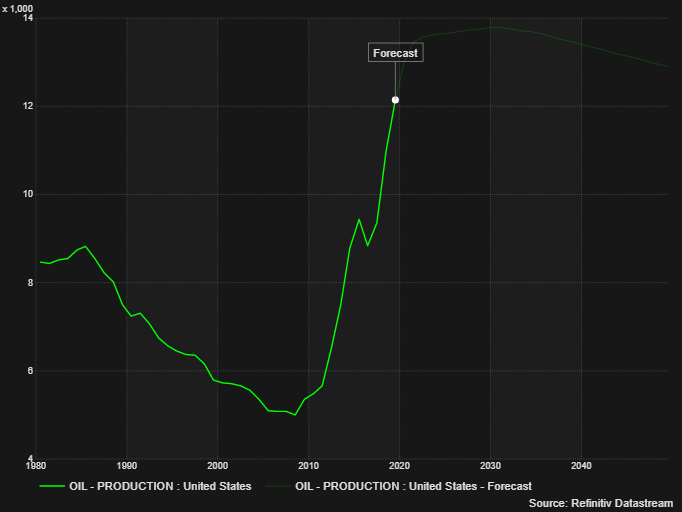
The U.S. Oil Production (Source: Thomson Reuters)
Likewise, the crude oil production across the United States also witnessed a sharp increase till October 2019 to average above 12.00 million barrels a day.
While the oil production across the major oil-producing countries is increasing, the demand side remains relatively weak, which has kept a lid on the crude oil prices, and the future movement in the crude oil prices could be decided by the demand-side factors.
To Know The Demand Side Factors, Also Read: Understanding Crude Oil Dynamics Through The Web Of Global Influencers
How is the Demand Side Looking At Present?
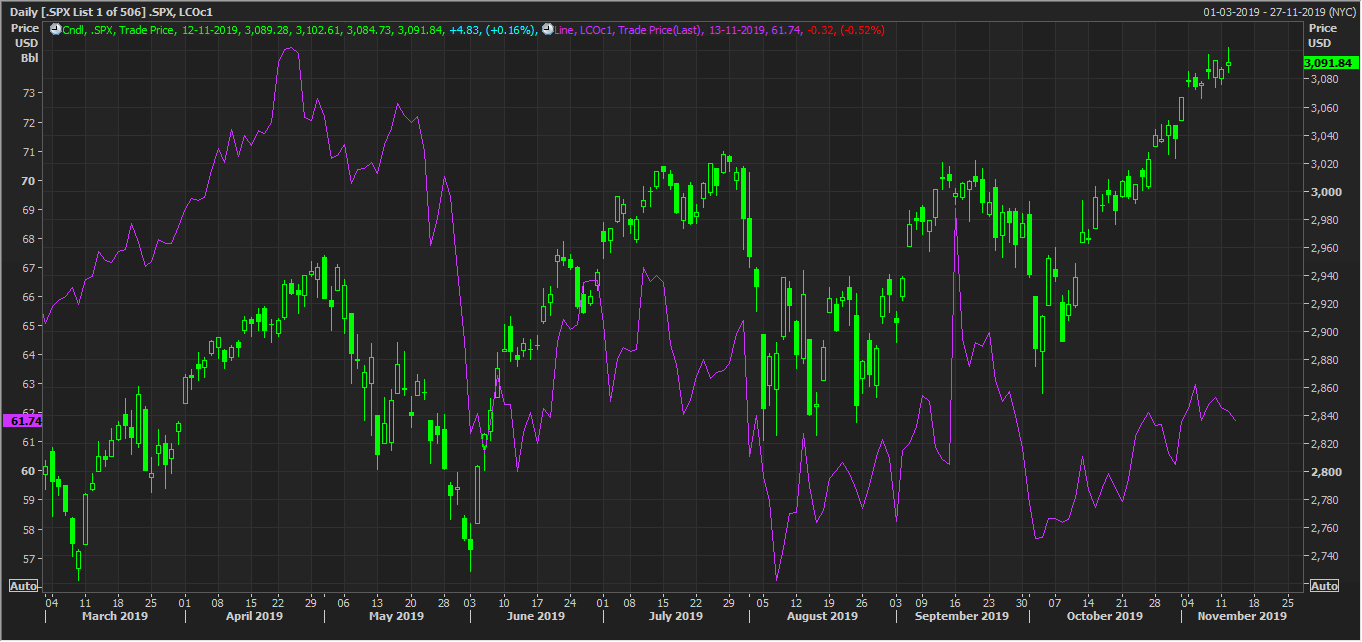
S&P 500 and LCO Daily Chart (Source: Thomson Reuters)
The crude oil prices are showing a positive correlation with the S&P 500 index, which is further suggesting that the current increase in price is demand-driven, as the market had already discounted the increase in global production activities.
The magnitude of increase or decrease in the crude oil prices would be further derived by the economic factor, which influences the global demand.
To reckon the movement in crude oil further, investors need to closely monitor the economic indicators and the overall global consumption scenario to gauge the price trend, as the production scenario or production-related factors could only bring some slight change.
However, the current trend in oil ,as suggested by the correlation between the oil and S&P 500 index along with a correlation between oil and implied volatility, remains susceptible to the economic events, which hold the potential of disrupting both the supply and the demand chain.
The current noise around the U.S-China trade talks is also an important factor, and any news/ events could also impact the prices and the aforementioned facts, trends, and outlook.
Disclaimer
This website is a service of Kalkine Media Pty. Ltd. A.C.N. 629 651 672. The website has been prepared for informational purposes only and is not intended to be used as a complete source of information on any particular company. Kalkine Media does not in any way endorse or recommend individuals, products or services that may be discussed on this site. Our publications are NOT a solicitation or recommendation to buy, sell or hold. We are neither licensed nor qualified to provide investment advice.
