


Source: Sebastian Duda, Shutterstock
Summary
- PPG Industries Inc. (NYSE:PPG) scaled a new all-time high on Friday and settled at USD 167.41, up by 8.73%.
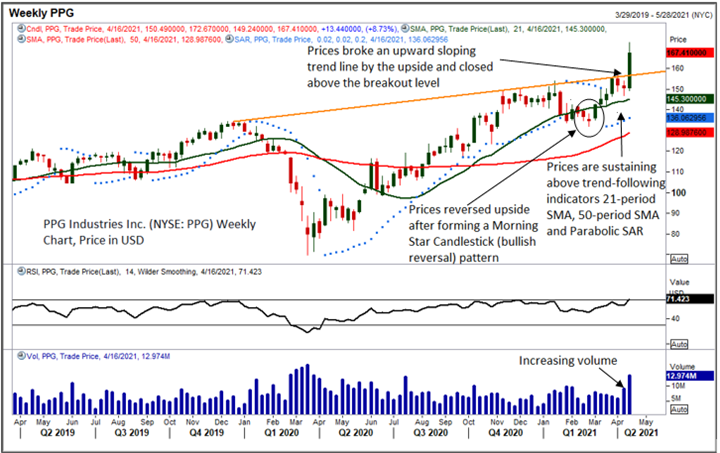
- PPG’s prices broke a rising trend line on the upside in the last trading session, indicating a continuation of upside movement in the stock.
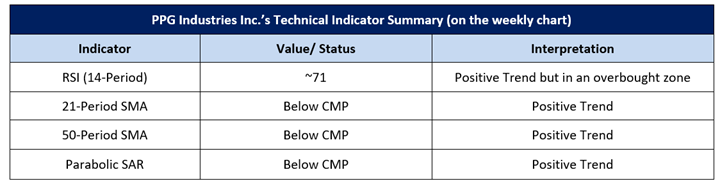
- The momentum oscillator RSI (14-period) is trading at ~71 levels, indicating a positive trend for the stock but at the same time, an overbought condition.
PPG Industries Inc. (NYSE:PPG) is a manufacturer of a wide range of coatings and specialty materials. PPG’s price has broken out of its all-time high on Friday and settled at USD 167.41, up by 8.73%. The stock outperformed some of its peers, such as Axalta Coating Systems Ltd (NYSE:AXTA) up 4.77%, Sherwin-Williams Co (NYSE:SHW) up 3.80%, and RPM International Inc (NYSE:ROM) up 2.47%. PPG’s prices recovered from the correction phase and created a new lifetime high. However, before entering the correction phase, prices witnessed a gain of ~120.45 percent from the low of USD 69.77 tested in March 2020 to the high of USD 153.81 made in January 2021. Thereafter prices corrected by 14.11 percent, from the high of USD 153.81 till the level of USD 132.10.
Flick through PPG Industries Inc. on a weekly chart
PPG’s prices started to move up after the formation of a Morning Star Candlestick pattern (bullish reversal) at the end of the correction phase. Prices witnessed more than 30% gain in the past 2 months and broke a rising trend line on the upside in the last trading session, indicating continuation of upside movement in the stock. The recent breakout is accompanied by good volume, further supporting a positive stance for the stock.
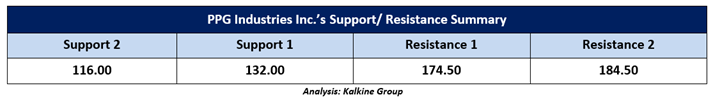
Currently, prices are trading around the lifetime high and as per the Fibonacci Price Projection, the next resistance levels appear at USD 174.50 followed by USD 184.50. On the lower side, USD 132.00 appears as the major support level for the stock followed by USD 116.00.
Source: EODHD/Others, Thomson Reuters; Analysis: Kalkine Group
Analysis: Kalkine Group
What are the Technical Indicators suggesting?
The momentum oscillator RSI (14-period) is trading at ~71 levels, indicating a positive trend for the stock but at the same time, it is also suggesting an overbought condition. Prices are continuously taking support of the trend-following indicator 21-period SMA and forming a positive crossover with another trend-following indicator 50-period SMA. Parabolic SAR is also sustaining below CMP and appears supportive of the stock prices. The summary of technical indicators is as below:
After analyzing the current price action coupled with the technical indicators, PPG Industries Inc. appears to be trading in a primary upward trend and getting support from several technical indicators. However, the leading indicator RSI (14-period) entered an overbought zone and as per theory this condition suggests that the prices could correct.
