


Summary
- S&P/ASX 200 A-REIT is showing a gradual recovery with the index appreciating nearly 54.96 per cent in the past few months, prompting many stocks such as Goodman Group (ASX:GMG) to reach a record high.
- However, bulls now seem to be taking an interest in the sector with the index attempting a volatility breakout.
- What would be the impact on sectorial stocks on a dynamic sentimental shift in the market?
- Goodman Group, Charter Hall, and Dexus Group on charts.
The S&P/ASX 200 A-REIT Index is following the suit of the major S&P/ASX 200 by entering a phase of consolidation after a gradual rise from the level of 877.40 (intraday low on 23 March 2020) to the level of 1,359.70 (intraday high on 9 June 2020), marking a recovery of ~ 54.96 per cent.
Post a gradual increase in the index; the REIT space is now seeming to be moving into hibernation with the index hovering around 1,300 to 1,200 for quite some time.
The recovery in the REIT space is currently backed by market sentiments with some of the stocks operating in the segment such as Goodman Group (ASX:GMG) reaching to a new record high of $18.440 (as on 13 August 2020), while some such as Dexus Property Group (ASX:DXS) consolidating with the index and sloping slightly down on charts.
S&P/ASX 200 A-REIT Index on Charts
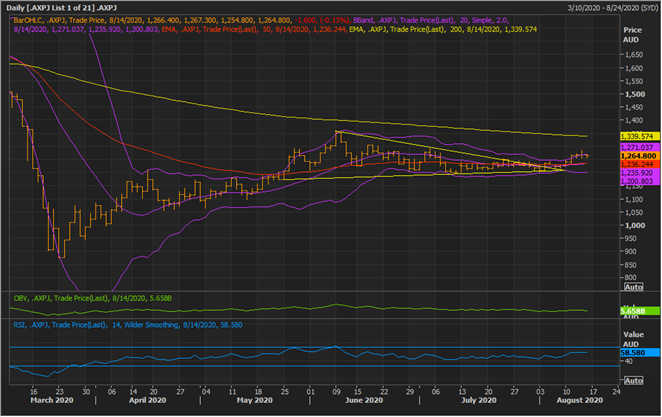
S&P/ASX 200 A- REIT Index Daily Chart (Source: EODHD/Others Eikon Thomson Reuters)
On following the daily chart, it could be seen that the index is presently consolidating in a range post a gradual recovery and attempted a volatility breakout with prices trying to breach the +2 Standard Deviation of the 20-day simple Bollinger band during the trading session on 13 August 2020.
- However, the index failed to sustain the volatility break and slipped below the +2 SD, where it is trading in a narrow day’s range now.
- Furthermore, it should be noticed that the index is now trading above the 50-day exponential moving average from few trading sessions, reflecting that bulls are currently in an accumulation phase; however, as the index is still trading below the 200-day exponential moving average, which could seed bearish sentiments and result in a tug-of-war between bulls and bears.
- The mean value of the 20-day simple Bollinger band, which is currently overlapping with the 50-day EMA should act as an immediate and decisive support for the index, followed by the -2 SD of the Bollinger, which is falling near the lower end of the consolidation range.
- The major resistance is intact at 200-day EMA and the previous high.
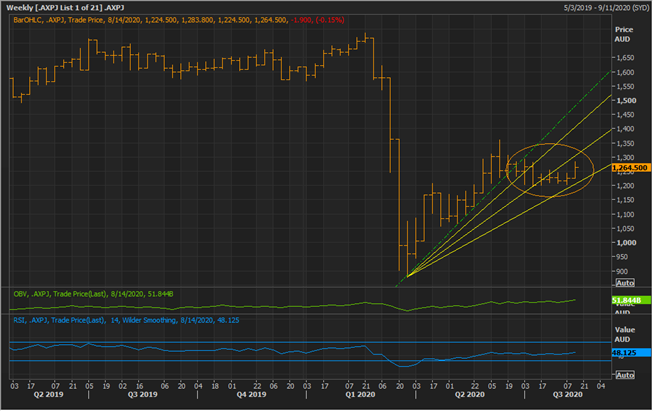
S&P/ASX 200 A- REIT Index Weekly Chart (Source: EODHD/Others Eikon Thomson Reuters)
On the weekly chart, the index has demonstrated a failed pipe formation with the emergence of two outside bar, which till now has not been followed by a breach of the high point of the pipe.
- However, in the past few weeks, the bulls seem to have gained interest in the index after nearly three to four weeks of consolidation, which could be inferred from the emergence of an outside bar during the current week post few small day’s range bars over the last couple of weeks.
- Furthermore, the outside bar appeared with a large volume on the chart, reflecting a sudden sentiment splash from the bulls.
Also, the 14-week RSI is currently below the overbought zone and near the mean value, suggesting that if bulls succeed, the rally could be steep.
Listed Stocks Following the Suit
Goodman Group (ASX:GMG)
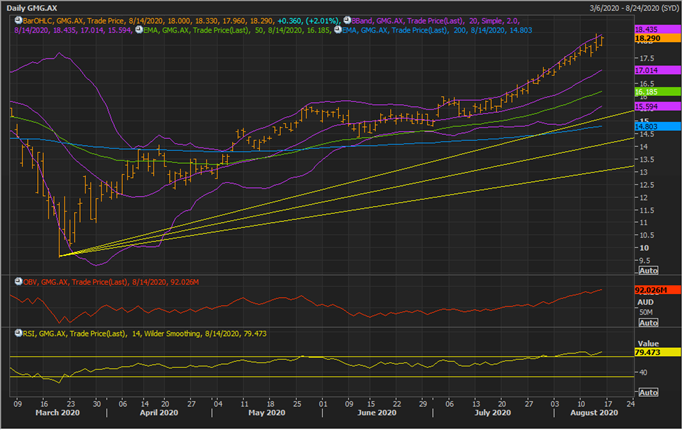
GMG Daily Chart (Source: EODHD/Others Eikon Thomson Reuters)
- On following the daily chart of GMG, it could be seen that just like the major index, the stock has also attempted a volatility breakout with prices giving an intraday penetration above the +2 SD of the 20-day simple Bollinger band.
- However, the stock was unable to sustain the volatility break and is now trading in a narrow day’s range (as on 14 August 2020).
- The primary trend in GMG is an uptrend as the current market price is trading above the pair of 50-day and 200-day EMA.
- The immediate and decisive support for the stock is at the mean value of the Bollinger, which is currently overlapping with the 50-day EMA.
- Furthermore, the surge in the stock price is well supported by volumes, which could be inferred from an upward sloping of On Balance Volume (or OBV) indicator.
- The 14-day RSI is in the overbought zone while the stock is taking resistance of the +2 SD, which is reflecting on a possibility of profit-booking activities in the near-term.
Charter Hall Group (ASX:CHC)
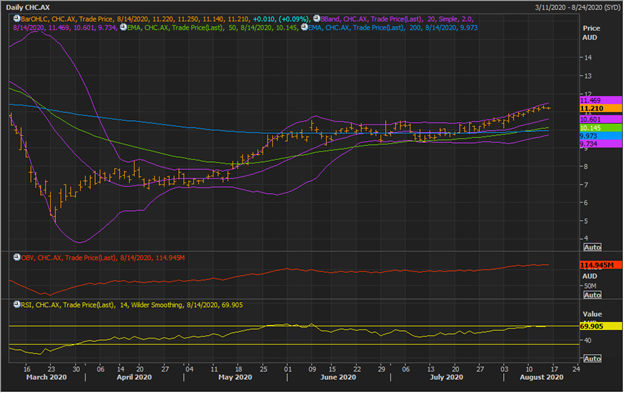
CHC Daily Chart (Source: EODHD/Others Eikon Thomson Reuters)
On following the CHC on the daily chart, it could be seen that the stock is closely mimicking the action of the index and its peer group stock – GMG with a recent attempt for a volatility break, which subsequently failed.
- However, the intermediate trend in the stock is now turning into an uptrend with the price crossing the pair of 50- and 200-day EMA, which is well supported by large volumes, as reflected by the OBV indicator.
- The primary and decisive support for the stock is at the mean value of the Bollinger band, which is overlapping with the 50-day EMA.
- Moreover, the RSI is slightly touching the overbought zone while the stock is failing to give a volatility breakout, which is stating the possibility of a near-term correction in price.
- The upper band or +2 SD should act as immediate resistance, followed by the previous peak.
REITs Stocks Diverging with the Index Behaviour
Dexus Group (ASX:DXS)
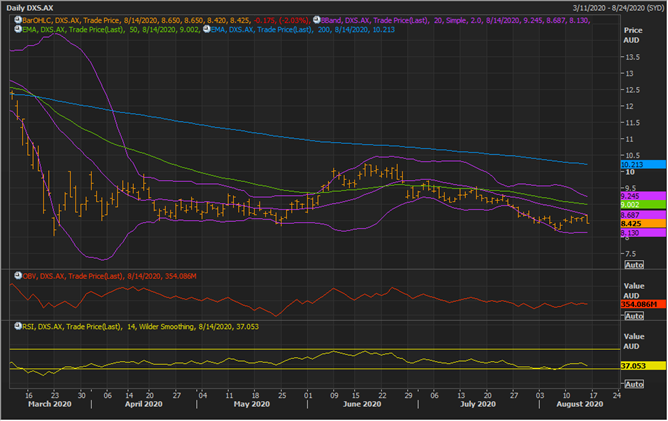
DXS Daily Chart (Source: EODHD/Others Eikon Thomson Reuters)
On following the daily chart, it could be seen that the stock is currently taking the support of -2 SD of the 20-day simple Bollinger band.
- However, DXS has slipped below the mean value and the pair of 50- and 200-day EMA, suggesting that the intermediate trend is now turning into a downtrend.
- DXS retested its mean during the day’s session on 14 August 2020, which should now act as immediate resistance for the stock, followed by the +2 SD and the 200-day EMA.
- While the stock is facing some challenges in gearing up like its peers, the 14-day RSI is hovering above the oversold zone, which could seed bearish sentiments ahead.
