


Highlights
- Pacific Smile Group Limited’s (ASX:PSQ) shares have rallied over 35% in the last two weeks
- These gains have come after the stock formed a fresh 52-week low at AU$1.39
- PSQ shares shot up more than 10% on Monday (20 June)
Pacific Smiles Group Limited (ASX: PSQ), which operates dental centres in Australia, took a beating in May. The stock corrected 54.87% from its 52-week high of AU$3.08 made in November 2021 to a fresh 52-week low of AU$1.39 on 06 June 2022.
However, in the past couple of weeks, PSQ shares have bounced more than 35%. On Monday itself, PSQ shares shot up more than 10%, outperforming some of its peers such as Virtus Health Ltd (ASX:VRT) which rose 0.26% and Capitol Health Limited (ASX:CAJ), which fell 3.57%.
After Monday’s rebound, Pacific Smile Group shares are down over 35% on a year-to-date basis, and down nearly 30% in the last one year. Will the stock extend its ongoing rebound? To answer this question, let’s analyse the formation of the stock on technical charts.
Also Read: Newcrest Mining (ASX:NCM) makes bullish engulfing pattern: Is a trend reversal in the offing?
The PSQ share price opened gap-up on Monday after a positive weekly close and settled with more than 10% gains. As per Fibonacci retracement levels, PSQ shares formed a base near 61.8% retracement level (from 52-week high) before moving upside, and this could act as a strong support zone for the stock in the near term. If the PSQ share price sustains around the current level, then as per the chart analysis, the next resistance level for the stock will be around AU$2.20 level.
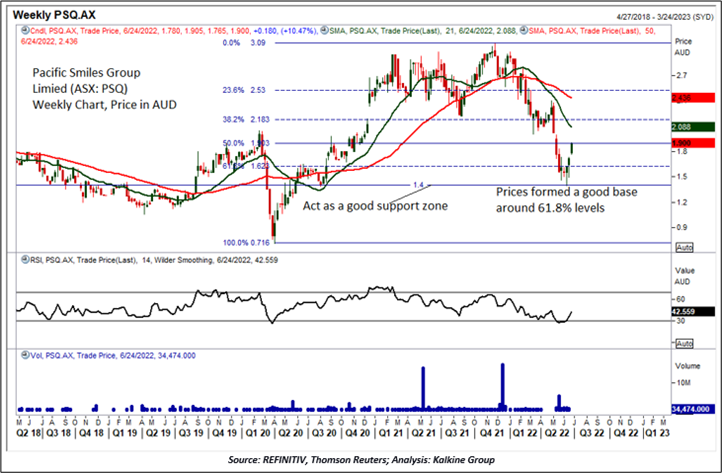
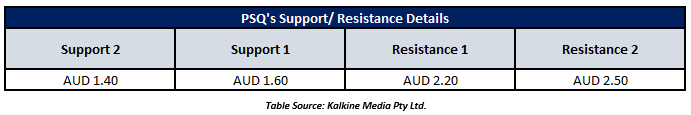
Also, if the stock continuous its rebound and manages to break above the resistance level of AU$2.20, then next resistance could be seen around AU$2.50, which may act as a strong hurdle in the near term. Meanwhile, on the lower side, the stock is likely to find support around AU$1.60 and AU$1.40 levels. The summary of resistance and support levels are as below:
Technical Indicator Analysis (On the weekly chart):
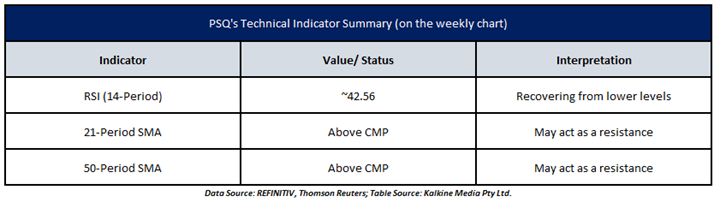
The momentum oscillator RSI (14-period) has recovered from an oversold zone and is currently showing a reading of around 42.56 levels (on Monday closing basis). However, the prices are still trading below the trend-following indicator 21-period and 50-period SMA, which may act as resistance levels for the stock. The summary of technical indicators is as below:
After analysing the current price action and the technical indicator, Pacific Smiles Group appears to have formed a near-term bottom around its 52-week level. A sustained upside move from current levels may see the stock test its initial resistance around AU$2.20 and a downside move below the support level of AUS 1.60 may lead to further correction in the stock.
Also Read: A look at 2 ASX-listed dental care stocks: SDI, PSQ
