
 AUS
AUS
 NZ
NZ
 UK
UK
 CA
CA
 USA
USA
 IND
IND








Highlights
- Anteris Technologies is an ASX-listed medical company engaged in designing and manufacturing of heart valves
- AVR shares have rallied over 200% in the past one year
- Recent gains in the stock were not accompanies with strong volumes
Anteris Technologies Ltd (ASX: AVR), which was formerly known as Admedus Ltd, is an Australian company that designs and develops cardio vocal equipment such as heart valves. The stock has witnessed an impressive rally of over 200%, rising from AU$7 to nearly AU$24, in the last one year. However, there has been intermittent corrections in the stock. After touching a high of AU$23.85 in February 2022, the stock corrected more than 40%. But over the past couple of weeks, the stock price has rebounded sharply; it has gained more than 70% from the lows of AU$14.06 seen in May 2022.
Also Read: Is short-term bottom in place for Pacific Smiles Group (ASX:PSQ) shares?
On Tuesday (21 June), AVR share prices jumped by 10.10%, outperforming its’ peers such as Atomo Diagnostics Limited (ASX:AT1), which declined 1.61% and Cardiex Limited (ASX:CDX), which rose by 4.84%. Is there more steam left in Anteris Technologies shares? To answer this question, let’s analyse the chart pattern of the stock.
Recent rally in Anteris Technologies lacks conviction!
AVR shares started falling in the latter half of February 2022 after the formation of a bearish engulfing (bearish reversal) candlestick pattern on the weekly chart. After hitting a low of AU$14.06 on May 19, 2022, the stock formed a hammer pattern on the lower level which reversed the trend to upward. At present, the stock is hovering around its’ 52-week high. However, the recent rally in the stock was neither accompanied with strong nor decent volumes. So, this raises doubts about the sustainability of the stock at current levels.
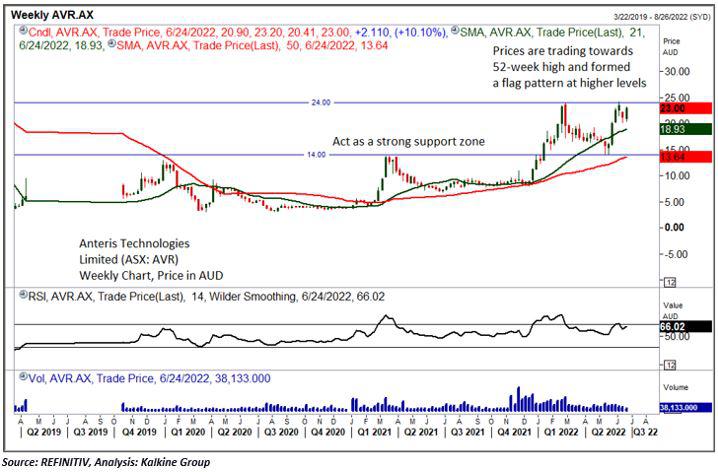
As per the technical chart shown above, AU$28.00 level may act as a strong near term resistance for the stock, and it may witness selling pressure. The next upside resistance level for the stock is at AU$30.00. Meanwhile, on the lower side, AU$ 20.00 and AU$ 18.00 levels may act as a trend reversal support. The summary of resistance and support are as below:

Technical Indicator Analysis (On the weekly chart):
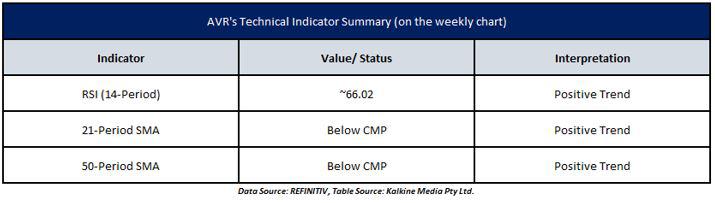
The momentum oscillator RSI (14-period) is hovering around the upper end of 66 level, indicating a positive stance. At the same time, it is also forming a negative divergence with the price action. The prices are trading above the trend-following indicator 21-period and 50-period SMA and seem supportive of the current trend. The summary of technical indicators is as below:
After analysing the current price action coupled with the technical indicators, the ongoing rally in Anteris Technologies Limited may become weak going forward as it lacks volumes. If the stock does not sustain at current level and moves below the support levels, then it may take some correction on the lower side. In the near term AU$28 level may act as a strong resistance for the stock.
Also Read: Newcrest Mining (ASX:NCM) makes bullish engulfing pattern: Is a trend reversal in the offing?
