
 AUS
AUS
 NZ
NZ
 UK
UK
 CA
CA
 USA
USA
 IND
IND








Highlights
- Newcrest Mining Limited (ASX:NCM) formed a bullish engulfing pattern on the lower band of the support zone
- NCM stock has declined by over 20% from its April high of AUD 28.96
- On Friday, NCM shares gave daily and weekly close around its 21-day simple moving average
Newcrest Mining Limited (ASX: NCM), an Australia-based company engaged in the exploration and development of gold and gold-copper concentrate, has been under selling pressure over the last few weeks. However, on Friday (17 June), the stock witnessed a sharp upside move to AUD 24.79 after making a low of AUD 24.22 on June 14. NCM stock took support around the major support line and moved upside. The stock outperformed some of its peers on Friday’s trading session, such as BHP Group Limited (ASX:BHP), which declined 3.38% and OZ Minerals Limited (ASX:OZL), which shed 5.65%.
Let us now analyse Newcrest Mining’s Technical chart to understand its short-term outlook.
As of now, NCM shares have declined by more than 20% from the high of AUD 28.96 made in April 2022 to the low of AUD 22.34 tested on June 14, 2022. Last week, the stock moved sharply toward its 21-day SMA, and on the weekly chart, a bullish engulfing pattern was formed around the lower band of the support zone. The formation of this pattern along with the rise in volume indicates a trend reversal could happen in the stock.
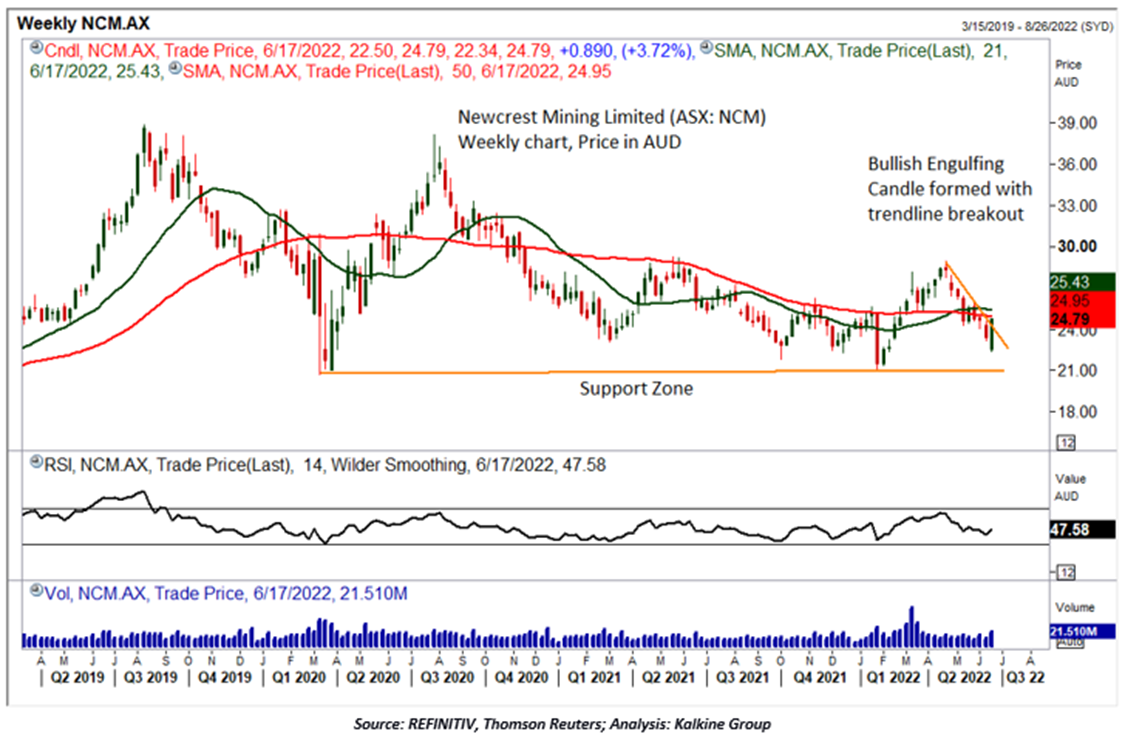
As per the technical chart given above, if NCM price sustains above AUD 26.00, which is the near term hurdle, then the stock may witness upside till its next resistance level of AUD 27.50. On the lower side, important support levels are at AUD 23.50 and AUD 22.00 which may act as a major support in the near term. The summary of resistance and support are as below:

Technical Indicator Analysis (On the weekly chart):
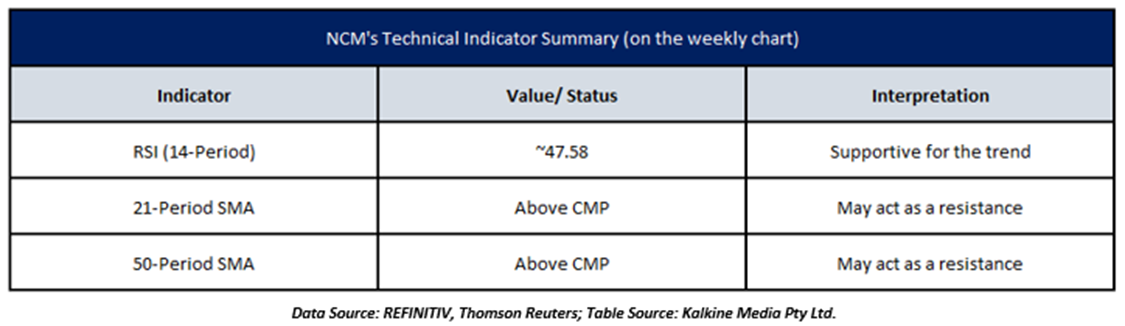
The momentum oscillator RSI (14-period) is trading at around 47.58 levels and recovering from the lower level, which could support a trend reversal in the stock. However, the prices are trading below the trend-following indicator 21-period and 50-period SMA, which may act as hurdle in the near term. Today, the stock ended 4.60% lower at AUD 23.65 apiece. The summary of technical indicators is as below:
After analyzing the current price action coupled with the technical indicator, Newcrest Mining Limited may witness a trend reversal from the major support levels. A sustained upmove from the current levels may test its initial resistance around AUD 26. On the other side, if the prices falls below the initial support level, then a further downside may be seen in the stock towards the next support level of AUD 22.00.
Also Read: Newcrest (ASX:NCM) shares move up on finding new gold-copper targets in WA
