


Highlights:
- Tassal Group Limited is a leading aquaculture producer in Australia.
- TGR shares had given a breakout of the falling trendline and made a new 52-week high on 28 June.
- The stock is trading above 21-period and 50-period SMA, which are the trend-following indicators.
Tassal Group Limited (ASX: TGR), a Tasmanian-based salmon farming company, seems to be unaffected by the current market gloom. Shares of the company, which is a leading aquaculture producer in Australia and accounts for nearly half of the domestic salmon production, have rallied over 30% in the last five trading sessions. It seems as if growing demand for salmon and its constrained supply are working in favour of the company.
On Tuesday (28 June), the stock witnessed a stellar rally of over 16% after the company informed that it has received a takeover proposal from Canada's Cooke Inc. The Canadian company sought to acquire 100% of Tassal’s ordinary shares for AU$4.85 per share, which was a 22% premium over Monday's (27 June) closing price of AU$3.96 per share. Cooke also disclosed it had acquired 5.4% of Tassal shares on 27 June after the market hours.
Do Read: Recce Pharmaceuticals (ASX:RCE) surpasses 200-week moving average; what next?
With Tuesday’s rally, the stock has jumped more than 44% from its recent low of AU$3.20 seen on 9 June 2022. The stock also made a fresh 52-week high of AU$4.620 yesterday.
Are we going to see more gains in Tassal Group shares in the coming days? Let’s analyse the weekly price chart of Tassal Group to get an indication about the possible future direction of its shares.
Tassal shares above 200-day SMA
As per the price chart given below, TGR shares have broken multiple hurdles in the last few trading sessions after bouncing from its crucial support zone of AU$3.20. On the weekly chart, TGR share price had given a breakout of the falling trendline and made a new 52-week high. On Tuesday, the stock has closed above its previous 52-week high levels and also surpassed the 200-day simple moving average (SMA). For the uninitiated, a stock is generally considered to be in an overall uptrend as long as it stays above the 200-day SMA on the daily time frame.
Meanwhile, as visible from the chart, the recent upside in the stock was accompanied by rising volumes as well, indicating higher market participation.
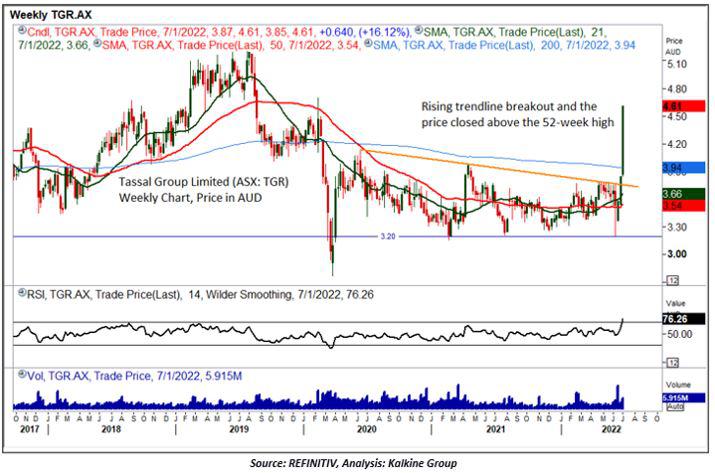
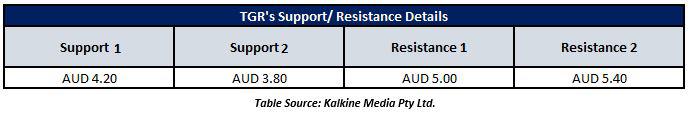
However, the stock is now near its immediate resistance level of AU$4.70. If it manages to cross the hurdle of AU$4.70, and sustains itself above this mark, then AU$5.00 may act as crucial resistance level for the stock in the near term. On the lower side, important support levels are placed at AU$4.20 followed by AU$3.80.
What does the stock’s RSI indicate?
A technical indicator, the Relative Strength Index (RSI) assesses if a stock is oversold or overbought. TGR’s momentum oscillator RSI (14-period) is currently showing a reading of around 76.26, which is considered as an overbought zone. Worth mentioing here is that RSI is plotted on a scale of 0 to 100 where a readings below 30 indicates a stock is oversold, and a reading above 70 indicates that it is overbought.
Since the price of the stock is above the 200-period, 21-period and 50-period SMA, it indicates an upward trend in the stock may continue.
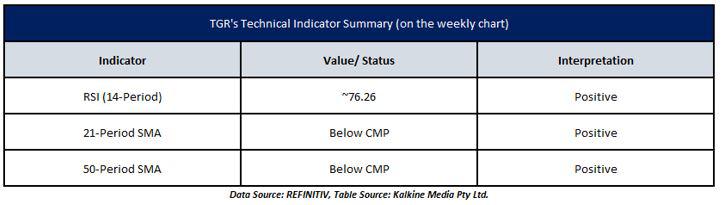
However, an overbought status as per the leading indicator (RSI) may create uncertainties about the future direction of the stock.
Also Read: Anteris Technologies (ASX:AVR) up over 200% in a year: Is more steam left in the stock?
