


Highlights
- A2M shares outperformed the Australian benchmark index (S&P/ASX 200), rising by 52.39%, compared to the index's 17.72% increase in the past year.
- The China IMF market declined by 8.6% in volume and 10.7% in value in FY24 and A2M expects further declines in the Chinese IMF market for FY25.
- A2M is in discussions to potentially acquire a manufacturing facility to enhance its infant milk formula capabilities and expand access to the Chinese market, but no acquisition is guaranteed.
The A2 Milk Company (ASX:A2M), founded in New Zealand in 2000, is involved in the sale and distribution of milk and dairy products. Over the past one year, the company’s shares have outperformed the Australian benchmark index, S&P/ASX 200, by a wide margin. While the index recorded a rise of 17.72%, A2M shares have surged by 52.39%. In the last month alone, A2M’s share price jumped 14%.
Shares of A2M have recorded significant rise despite challenges in one of its key market - the China IMF (infant milk formula) market. The company’s annual report revealed that the China IMF market dropped by 8.6% in volume and 10.7% in value in FY24. This downturn was attributed to several factors, including cumulative impact of fewer newborns, challenging macroeconomic conditions and increase in competition intensity.
A2M acknowledged that the situation in the Chinese IMF market is likely to remain challenging, with further declines in market value anticipated for FY25.
Following this update, A2M’s share price took a hit, dropping by over 18%. However, on 27 September 2024, the shares rebounded and recorded a rise of over 8%, despite any price sensitive news.
This sudden surge can be explained by broader economic developments in China. On 24 September 2024, in China, several government economic stimulus measures were announced, and it is expected that China might introduce further stimulus measures. This update boosted the China A 300 Consumer Staples index by 27%, and shares of companies dealing in nutrition and dairy sector also marked significant rise for the week ended 27 September 2024.
Given A2M’s significant exposure to Chinese consumer demand, these stimulus measures are likely a major factor behind the recent surge in its share price.
Further, A2M recently shared that it is in discussions regarding the potential acquisition of a manufacturing facility, a move that aligns with its publicly stated goal of enhancing its IMF manufacturing capabilities and increasing access to the Chinese market. However, there is no guarantee that discissions will end in acquisition.
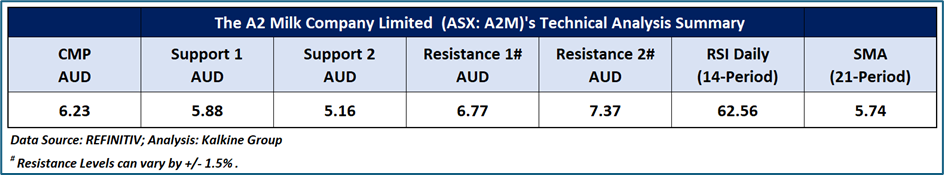
A2M’s Technical Analysis:
On 27 September 2024, A2M's stock price completed a bullish Island Reversal pattern, signalling a positive trend. Since then, the stock has been developing a Flag pattern, indicating that the short-term uptrend remains intact. Additionally, the RSI (14-period) is trading above its midpoint, providing further support for the mentioned recommendation. Prices are trading above both the 21-period and 50-day SMAs, which may potentially function as dynamic support levels for the stock; in contrast, the stock’s most recent high might act as a resistance level. Critical support for the stock is positioned at AUD 5.88, while key resistance is placed at AUD 6.77.
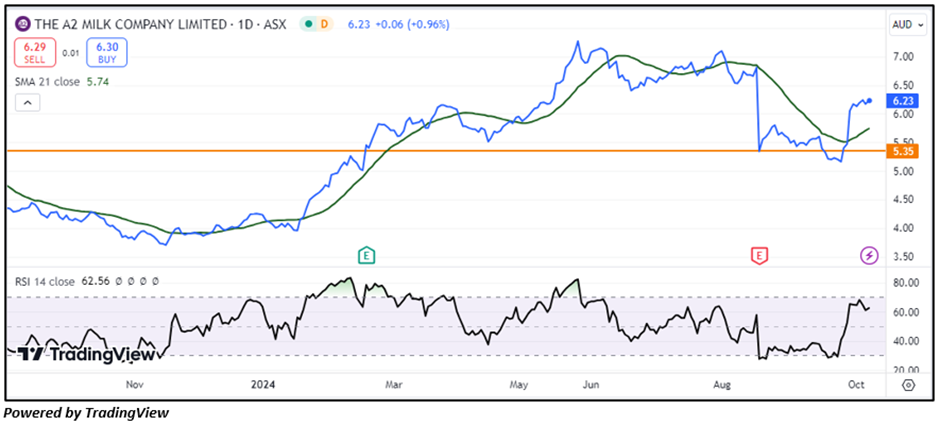
Daily technical chart- A2M
The technical levels for the stock were evaluated as per the closing price of AUD 6.37 per share, up 2.25%, as on 07 October 2024.
Note 1: Past performance is neither an Indicator nor a guarantee of future performance.
Technical Indicators Defined:
Support: A level at which the stock prices tend to find support if they are falling, and a downtrend may take a pause backed by demand or buying interest. Support 1 refers to the nearby support level for the stock, and if the price breaches the level, then Support 2 may act as the crucial support level for the stock.
Resistance: A level at which the stock prices tend to find resistance when they are rising, and an uptrend may take a pause due to profit booking or selling interest. Resistance 1 refers to the nearby resistance level for the stock and if the price surpasses the level, then Resistance 2 may act as the crucial resistance level for the stock.
Stop-loss: It is a level to protect further losses in case of unfavourable movement in the stock prices.
The Green colour line reflects the 21-period moving average. SMA helps to identify existing price trends. If the prices are trading above the 21-period, prices are currently in a bullish trend (Vice – Versa).
The Blue colour line reflects the 50-period moving average. SMA helps to identify existing price trends. If the prices are trading above the 50-period, prices are currently in a bullish trend (Vice – Versa).
The Orange/ Yellow colour line represents the Trendline.
The Purple colour line in the chart’s lower segment reflects the Relative Strength Index (14-Period), which indicates price momentum and signals momentum in trend. A reading of 70 or above suggests overbought status, while a reading of 30 or below suggests an oversold status.
Disclaimer
This article has been prepared by Kalkine Media, echoed on the website kalkinemedia.com/au and associated pages, based on the information obtained and collated from the subscription reports prepared by Kalkine Pty. Ltd. [ABN 34 154 808 312; AFSL no. 425376] on Kalkine.com.au (and associated pages). The principal purpose of the content is to provide factual information only for educational purposes. None of the content in this article, including any news, quotes, information, data, text, reports, ratings, opinions, images, photos, graphics, graphs, charts, animations, and video is or is intended to be, advisory in nature. The content does not contain or imply any recommendation or opinion intended to influence your financial decisions, including but not limited to, in respect of any particular security, transaction, or investment strategy, and must not be relied upon by you as such. The content is provided without any express or implied warranties of any kind. Kalkine Media, and its related bodies corporate, agents, and employees (Kalkine Group) cannot and do not warrant the accuracy, completeness, timeliness, merchantability, or fitness for a particular purpose of the content or the website, and to the extent permitted by law, Kalkine Group hereby disclaims any and all such express or implied warranties. Kalkine Group shall NOT be held liable for any investment or trading losses you may incur by using the information shared on our website.
