


Highlights
- Lovisa reported AUD 405.93 million in revenue for H1 FY2025, up 8.8% year-over-year.
- EBITDA rose 9.8% YoY to AUD 140.94 million, with profit before tax increasing 10.8% YoY.
- 57 new stores opened during H1, bringing the total to 943 across 49 markets.
- Lovisa aims to expand to 956 stores, entering its 50th market (Zambia) in H2.
Lovisa Holdings Limited (ASX:LOV) is an Australian fast-fashion jewellery retailer. The company designs, develops, sources, and merchandises its products internally, with revenue stream driven through a growing network of physical stores and online channels.
For the half-year ended 29 December 2024 (H1FY25), Lovisa reported a revenue of AUD 405.93 million, up 8.8% YoY, and EBITDA of AUD 140.94 million, reflecting a 9.8% YoY increase. During the reported period, profit before tax rose 10.8% YoY to AUD 80.56 million, underpinned by continued store network growth.
During this period, Lovisa opened 57 new stores, expanding its global footprint to 943 outlets across 49 markets. The company maintained operational cash flow, closing the period with AUD 141.1 million in cash and net cash of AUD 6.7 million. An interim dividend of 50 cents per share was declared.
Historical Performance
Lovisa has delivered consistent revenue growth over the past five years, from AUD 242.18 million in FY2020 to AUD 698.66 million in FY2024. Gross margins improved steadily, rising from 72.73% in FY2020 to 76.61% in FY2024, showcasing the company’s ability to manage pricing strategies effectively during its expansion phase. Lovisa’s current ratio also remained healthy at 1.03x in FY2024.
Total debt marginally declined from AUD 372.59 million in FY2023 to AUD 359.07 million in FY2024.
Recent Business Updates
As of 22 May 2025, State Street Corporation and its subsidiaries became a substantial shareholder in Lovisa, holding a 5.08% stake, equating to over 5.6 million shares.
Outlook
Looking ahead, Lovisa anticipates continued momentum in store rollouts and international expansion. In the first seven weeks of H2 FY25 alone, the company opened 16 new stores, targeting a total of 956 outlets. The retailer is also poised to enter its 50th market, Zambia.
Share performance of LOV
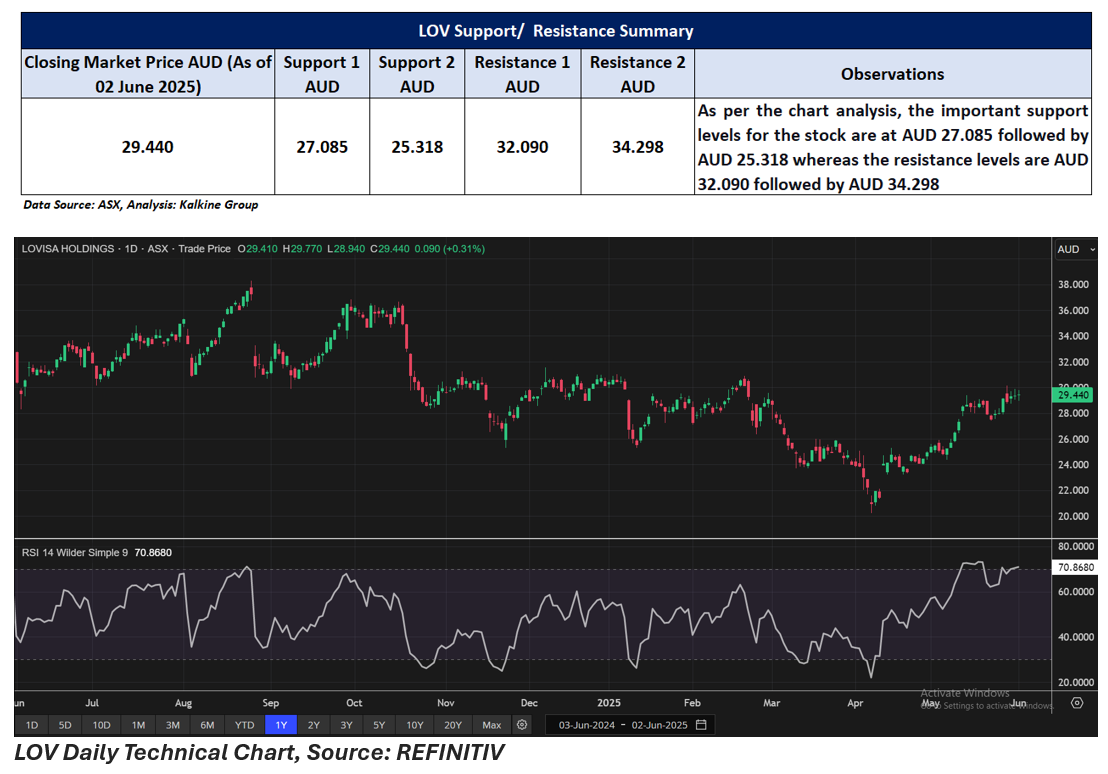
LOV shares closed 0.31% higher at AUD 29.44 per share on 02 June 2025. Over the past month, the stock has risen by 15.59%, while the year-to-date performance shows a decline of approximately 2.39%. On a yearly basis, the share price has fallen by 13.18%, and in the past nine months, it has declined by 8.14%.
The company’s 52-week high of AUD 38.29 was recorded on 26 August 2024, while its 52-week low of AUD 20.23 was noted on 7 April 2025.
Support and Resistance Summary
Note 1: Past performance is neither an Indicator nor a guarantee of future performance.
Note 2: The reference date for all price data, and currency, is 02 June 2025. The reference data in this report has been partly sourced from EODHD/Others.
Technical Indicators Defined:
Support: A level at which the stock prices tend to find support if they are falling, and a downtrend may take a pause backed by demand or buying interest. Support 1 refers to the nearby support level for the stock and if the price breaches the level, then Support 2 may act as the crucial support level for the stock.
Resistance: A level at which the stock prices tend to find resistance when they are rising, and an uptrend may take a pause due to profit booking or selling interest. Resistance 1 refers to the nearby resistance level for the stock and if the price surpasses the level, then Resistance 2 may act as the crucial resistance level for the stock.
Disclaimer
This article has been prepared by Kalkine Media, echoed on the website kalkinemedia.com/au and associated pages, based on the information obtained and collated from the subscription reports prepared by Kalkine Pty. Ltd. [ABN 34 154 808 312; AFSL no. 425376] on Kalkine.com.au (and associated pages). The principal purpose of the content is to provide factual information only for educational purposes. None of the content in this article, including any news, quotes, information, data, text, reports, ratings, opinions, images, photos, graphics, graphs, charts, animations, and video is or is intended to be, advisory in nature. The content does not contain or imply any recommendation or opinion intended to influence your financial decisions, including but not limited to, in respect of any particular security, transaction, or investment strategy, and must not be relied upon by you as such. The content is provided without any express or implied warranties of any kind. Kalkine Media, and its related bodies corporate, agents, and employees (Kalkine Group) cannot and do not warrant the accuracy, completeness, timeliness, merchantability, or fitness for a particular purpose of the content or the website, and to the extent permitted by law, Kalkine Group hereby disclaims any and all such express or implied warranties. Kalkine Group shall NOT be held liable for any investment or trading losses you may incur by using the information shared on our website.
