


Highlights
- Propel Funeral Partners reported a 12% YoY increase in revenue to AUD 115.2 million in 1HFY25.
- Funeral service volumes rose 8.6% YoY in 1HFY25, with average revenue per service increasing 2.6% to AUD 6,727.
- The company completed three acquisitions worth AUD 13 million in 1HFY25 and confirmed positive momentum heading into the second half of FY25.
Propel Funeral Partners Limited (ASX:PFP) provides death care services in Australia and New Zealand. In the half-year ended 31 December 2024 (1HFY25), Propel Funeral Partners recorded revenue of AUD 115.2 million, representing a 12 % increase compared to the previous corresponding period. Operating EBITDA rose to AUD 29.9 million in 1HFY25, up 9.2% YoY, while operating NPAT climbed 21.1% YoY to reach AUD 12.2 million.
Half year performance was driven by higher funeral volumes, which rose 8.6% YoY to 11,549 services. Additionally, average revenue per funeral rose to AUD 6,727, reflecting a 2.6% improvement in pricing.
As of 31 December 2024, the company reported AUD 640.5 million in assets, with a modest gearing ratio of approximately 26%, and around AUD 144 million in available funding capacity.
During the reported period, Propel also expanded its footprint through three acquisitions, investing approximately AUD 13 million in Decra, Twentymans Funeral Services, and Richmond Funeral Home, which includes Clareville Crematorium.
Recent Developments
Through an ASX update dated 15 April 2025, the company informed that Norges Bank had become a substantial shareholder, acquiring a 5.09% voting stake in the company as of 11 April.
Strategic Outlook
Propel has maintained an active acquisition strategy, having invested approximately AUD 302 million since its IPO. The company operates in a highly fragmented industry, which presents multiple opportunities for inorganic growth.
The company entered the second half of FY25 with positive operating momentum. Propel reported over 10% revenue growth in January 2025, supported by increased funeral volumes, improved pricing, and favourable demographic trends in Australia and New Zealand.
Top 10 shareholders of PFP
The top 10 shareholders of PFP have around 33.95% shareholding in the company. DKH TI Pty. Ltd. and Pengana Capital Group Limited have maximum stake in the company with a shareholding of ~10.68% and 5.65%, respectively.
PFP Share performance
Over the past six months, PFP shares have declined by approximately 14.94%, with a larger correction of around 17.26% over the last nine months. The stock is currently trading near its 52-week low of AUD 4.77, having ranged between AUD 4.77 and AUD 6.16 during the past year.
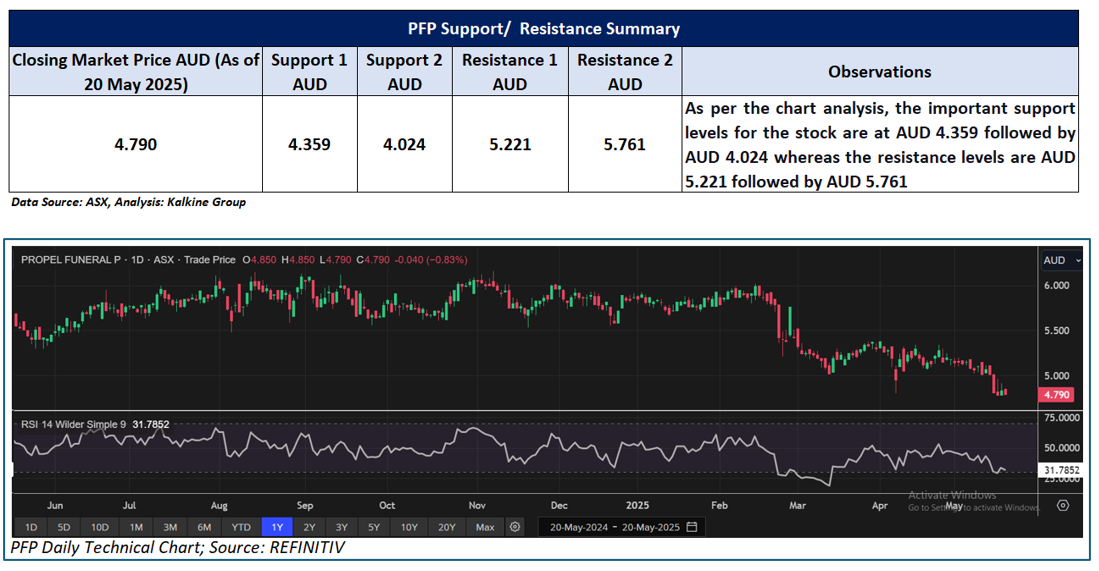
Support and Resistance Summary
Note 1: Past performance is neither an Indicator nor a guarantee of future performance.
Note 2: The reference date for all price data, and currency, is 20 May 2025. The reference data in this report has been partly sourced from EODHD/Others.
Technical Indicators Defined:
Support: A level at which the stock prices tend to find support if they are falling, and a downtrend may take a pause backed by demand or buying interest. Support 1 refers to the nearby support level for the stock and if the price breaches the level, then Support 2 may act as the crucial support level for the stock.
Resistance: A level at which the stock prices tend to find resistance when they are rising, and an uptrend may take a pause due to profit booking or selling interest. Resistance 1 refers to the nearby resistance level for the stock and if the price surpasses the level, then Resistance 2 may act as the crucial resistance level for the stock.
Disclaimer
This article has been prepared by Kalkine Media, echoed on the website kalkinemedia.com/au and associated pages, based on the information obtained and collated from the subscription reports prepared by Kalkine Pty. Ltd. [ABN 34 154 808 312; AFSL no. 425376] on Kalkine.com.au (and associated pages). The principal purpose of the content is to provide factual information only for educational purposes. None of the content in this article, including any news, quotes, information, data, text, reports, ratings, opinions, images, photos, graphics, graphs, charts, animations, and video is or is intended to be, advisory in nature. The content does not contain or imply any recommendation or opinion intended to influence your financial decisions, including but not limited to, in respect of any particular security, transaction, or investment strategy, and must not be relied upon by you as such. The content is provided without any express or implied warranties of any kind. Kalkine Media, and its related bodies corporate, agents, and employees (Kalkine Group) cannot and do not warrant the accuracy, completeness, timeliness, merchantability, or fitness for a particular purpose of the content or the website, and to the extent permitted by law, Kalkine Group hereby disclaims any and all such express or implied warranties. Kalkine Group shall NOT be held liable for any investment or trading losses you may incur by using the information shared on our website.
