


Highlights
- Healius is refocusing on its core pathology segment following the AUD 822 million sale of Lumus Imaging.
- Pathology revenue rose 7% YoY; underlying revenue grew 10%, with EBITDA up 3.3% in 1HFY25.
- HLS’ net loss shrank significantly to AUD 12.8 million in 1HFY25 from AUD 635.8 million YoY, despite ongoing cost pressures.
Healius Limited (ASX:HLS), an Australian healthcare company operating for over three decades, is sharpening its strategic focus on its core pathology business. For the half-year ended 31 December 2024 (1HFY25), Healius reported a 7% YoY increase in pathology revenue, driven by performance of genomic diagnostics, increasing GP and specialist attendances, and expansion in B2B markets. The momentum continues into January and early February 2025, with volumes and revenues holding steady.
Furthermore, the company increased its focus on expanding its core pathology operations, following the sales of Lumus Imaging in May 2025 for AUD 822 million.
Recent Financial Insights
In 1HFY25, HLS recorded a 10% YoY increase in underlying revenue, reaching AUD 933.9 million, up from AUD 849.0 million in 1HFY24. The growth was underpinned by performance in pathology (up 7%) and imaging (up 13.3%), coupled with higher GP and specialist attendances, productivity gains, and growth in genomic diagnostics and B2B markets.
Meanwhile, underlying EBITDA grew by 3.3% YoY to AUD 164.4 million in 1HFY25. Despite these gains, the company posted a reported loss of AUD 12.8 million, though a significant improvement from the AUD 635.8 million loss in the prior corresponding period. Contributing factors to the loss included rising labour costs, Medicare rebate cuts, debt levels, and uncertainties related to Agilex and the Lumus Imaging divestment.
Recent Business Updates
On 5 May 2025, Healius announced a fully franked special dividend of 41.3 cents per share , totalling approximately AUD 300 million.
On 21 May 2025, State Street Corporation and its subsidiaries increased their voting power in Healius from 5.29% to 6.89%, as of 19 May 2025.
Share performance of HLS
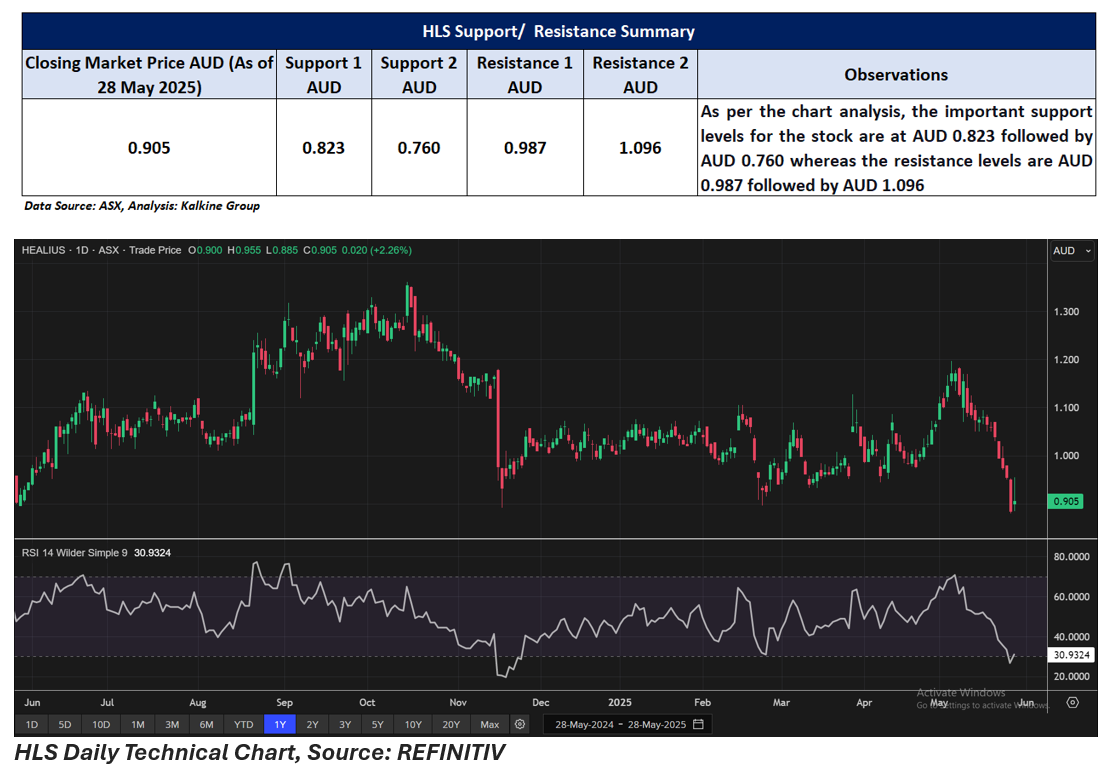
Shares of Healius closed 2.26% higher at AUD 0.905 on 28 May 2025, reflecting an intraday gain of AUD 0.020. Over the past month, the share price declined 11.67%, and on a year-to-date basis, it dropped 9.73%. The stock’s one-year performance remained nearly flat, up just 0.14%.
Healius hit a 52-week high of AUD 1.361 on 15 October 2024 and recorded a 52-week low of AUD 0.880 on 27 May 2025.
Support and Resistance Summary
Note 1: Past performance is neither an Indicator nor a guarantee of future performance.
Note 2: The reference date for all price data, and currency, is 28 May 2025. The reference data in this report has been partly sourced from EODHD/Others.
Technical Indicators Defined:
Support: A level at which the stock prices tend to find support if they are falling, and a downtrend may take a pause backed by demand or buying interest. Support 1 refers to the nearby support level for the stock and if the price breaches the level, then Support 2 may act as the crucial support level for the stock.
Resistance: A level at which the stock prices tend to find resistance when they are rising, and an uptrend may take a pause due to profit booking or selling interest. Resistance 1 refers to the nearby resistance level for the stock and if the price surpasses the level, then Resistance 2 may act as the crucial resistance level for the stock.
Disclaimer
This article has been prepared by Kalkine Media, echoed on the website kalkinemedia.com/au and associated pages, based on the information obtained and collated from the subscription reports prepared by Kalkine Pty. Ltd. [ABN 34 154 808 312; AFSL no. 425376] on Kalkine.com.au (and associated pages). The principal purpose of the content is to provide factual information only for educational purposes. None of the content in this article, including any news, quotes, information, data, text, reports, ratings, opinions, images, photos, graphics, graphs, charts, animations, and video is or is intended to be, advisory in nature. The content does not contain or imply any recommendation or opinion intended to influence your financial decisions, including but not limited to, in respect of any particular security, transaction, or investment strategy, and must not be relied upon by you as such. The content is provided without any express or implied warranties of any kind. Kalkine Media, and its related bodies corporate, agents, and employees (Kalkine Group) cannot and do not warrant the accuracy, completeness, timeliness, merchantability, or fitness for a particular purpose of the content or the website, and to the extent permitted by law, Kalkine Group hereby disclaims any and all such express or implied warranties. Kalkine Group shall NOT be held liable for any investment or trading losses you may incur by using the information shared on our website.
