AUS
AUS
 NZ
NZ
 UK
UK
 CA
CA
 USA
USA
 IND
IND




_07_03_2026_03_50_21_133108.jpg)

Highlights
- H1 FY24 revenue fell 6.6% to GBP 36.60 million; adjusted EBITDA decreased 24.0%
- Free cash flow rose 71.4% to GBP 1.20 million, supported by improved working capital
- Group revenue is expected to exceed GBP 81.0 million in FY24, with positive Q3 trading
Tracsis PLC (LSE:TRCS) is a software company listed on the FTSE AIM 100 Index. It focuses on transport technology and provides software, hardware, data analytics, and geographic information systems (GIS) for the transport sector. The company has a market capitalization of GBP 166.89 million.
In H1 FY24, Tracsis PLC reported revenue of GBP 36.60 million, down 6.6% from GBP 39.20 million in H1 FY23. This decline was primarily due to the anticipated non-recurrence of perpetual rail technology software licenses from H1 FY23. Adjusted EBITDA also fell to GBP 5.70 million, a decrease of 24.0%, influenced by prior year investments. However, these investments are expected to yield positive results by year-end.
On a brighter note, free cash flow improved to GBP 1.20 million, reflecting a 71.4% increase from GBP 0.70 million in H1 FY23. This increase was attributed to a GBP 0.3 million rise in working capital, which resulted from a reduction in trade receivables. Additionally, net capital expenditure rose to GBP 0.9 million, driven by investments in IT assets and the vehicle fleet, including electric vehicles.
Further, the company had a current ratio of 1.78x and a debt-equity ratio of 0.03x in H1 FY24, versus the industry median of 1.57x and 0.19x, respectively.
Recent Business Update
According to the company’s trading update from 29 August 2024, group revenue is expected to exceed GBP 81.0 million. Adjusted EBITDA is projected to be around GBP 13.0 million, with an adjusted EBITDA margin of about 16%, in line with revised guidance.
Cash balances have increased by over GBP 4 million since May 2024, reaching GBP 19.8 million as of July 2024. This allows for ongoing investment in technology and supports both organic growth and targeted acquisitions. The results for the year ending 31 July 2024 will be announced on Wednesday, 20 November 2024.
Company Outlook
The company has entered the second half of the year with confidence in its financial position and growth prospects, despite some short-term uncertainties in procurement and delivery. Q3 trading has begun positively, with high activity levels in both divisions.
New contracts secured after the reporting period are expected to boost revenue in FY24, especially in North America. The board believes that FY24's performance will meet market expectations, supported by strong market drivers and an expanding pipeline of M&A opportunities.
Top 10 Shareholders
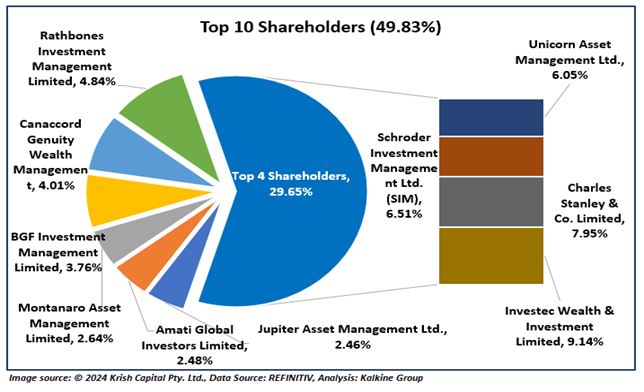
Tracsis PLC's top 10 shareholders own approximately 49.83% of the total shares. Investec Wealth & Investment Limited has the largest shareholding, with about 9.14%. This is followed by Charles Stanley & Co. Limited, which holds around 7.95%. The chart below illustrates these holdings.
Stock Price Information
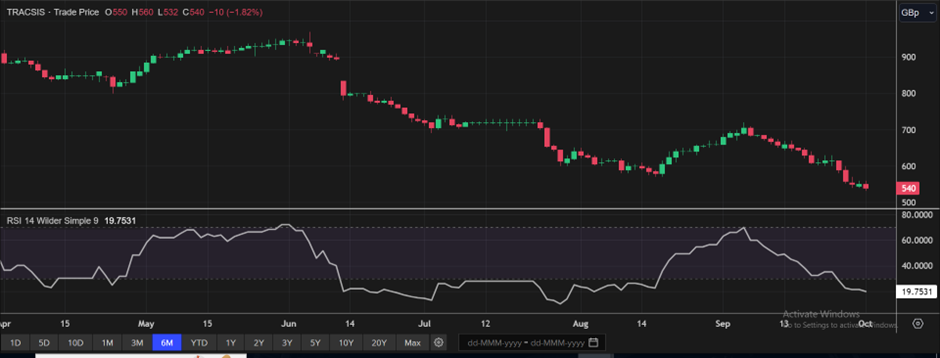
The stock price of TRCS has fallen by approximately 18.18% in the last month. Over the past six months, it has decreased by about 38.98%. The stock reached a 52-week low of GBX 532.00 and a 52-week high of GBX 980.00. As of 01 October, 2024, the stock’s closing price was GBX 540.00.
Note 1: Past performance is not a reliable indicator of future performance.
Note 2: The reference data for all price data, currency, technical indicators, support, and resistance levels is 01 October 2024. The reference data in this report has been partly sourced from EODHD/Others.