


Highlights
- Maas Group Holdings reported a marginal 0.27% YoY revenue increase to AUD 473.94 million for 1HFY25.
- In 1HFY25, the company's underlying EBITDA declined by 2.16% YoY, while net profit after tax dropped by 7.5% to AUD 31.33 million.
- MGH reaffirmed its FY25 guidance, expecting underlying EBITDA between AUD 215 million and AUD 245 million, and plans asset sales exceeding AUD 100 million.
Maas Group Holdings Limited (ASX:MGH) is an Australian provider of construction materials, equipment, and services. The company has a diversified presence across the civil and infrastructure sectors. In the half-year ended 31 December 2024 (1HFY25), MGH reported a slight year-on-year (YoY) revenue increase of 0.27% to AUD 473.94 million, up from AUD 472.65 million in 1HFY24. This growth was largely driven by higher sales volumes across concrete, asphalt, quarry products, and land inventory. However, underlying EBITDA slipped by 2.16% YoY to AUD 95.01 million, while net profit after tax attributable to owners fell by nearly 7.5% YoY to AUD 31.33 million from AUD 33.85 million in the same period last year.
Despite this, MGH remained proactive by repurchasing 13,267 of its shares as of 8 May 2025 under an on-market buy-back program.
During the reported period, the company recorded a gross profit margin of 52.6%, significantly above the industry median of 10.2%, and a current ratio of 1.88x, compared to the industry median of 1.16x.
Nonetheless, challenges remain. MGH experienced a decline in asset turnover (0.29x in 1HFY25 vs 0.32x in 1HFY24) and a drop in operating margin (9.4% vs 12.0%), suggesting margin pressures.
Outlook
MGH has reaffirmed its financial outlook for FY25, projecting underlying EBITDA between AUD 215 million and AUD 245 million. The company also expects to sell assets worth over AUD 100 million during the fiscal year.
Growth Prospects for Industrial Stocks
Furthermore, macroeconomic trends in Australia provide a supportive backdrop. According to data from the Australian Bureau of Statistics, business turnover has been rising since September 2024, with a 0.5% increase in March 2025 (trend terms) and 0.4% seasonally adjusted growth. Sectors such as wholesale trade (+2.2%), telecommunications (+1.8%), and manufacturing (+1.6%) posted the most significant gains, boding well for industrial and infrastructure-focused firms like MGH.
Share performance of MGH
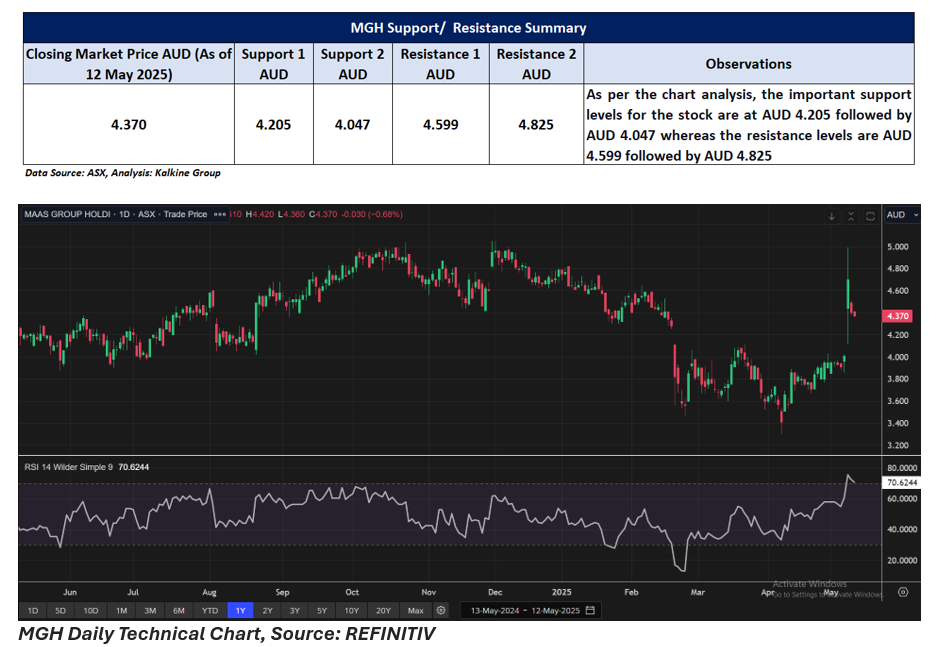
MGH shares closed 0.68% lower at AUD 4.37 per share on 12 May 2025. In a month, the share price has increased by almost 16.53% and on a year-to-date basis it has lost 8.79%.
52-week high of MGH is AUD 5.05, recorded on 2 December 2024 and 52-week low is AUD 3.30, recorded on 7 April 2025.
Support and Resistance Summary
Note 1: Past performance is neither an Indicator nor a guarantee of future performance.
Note 2: The reference date for all price data, and currency, is 12 May 2025. The reference data in this report has been partly sourced from EODHD/Others.
Technical Indicators Defined:
Support: A level at which the stock prices tend to find support if they are falling, and a downtrend may take a pause backed by demand or buying interest. Support 1 refers to the nearby support level for the stock and if the price breaches the level, then Support 2 may act as the crucial support level for the stock.
Resistance: A level at which the stock prices tend to find resistance when they are rising, and an uptrend may take a pause due to profit booking or selling interest. Resistance 1 refers to the nearby resistance level for the stock and if the price surpasses the level, then Resistance 2 may act as the crucial resistance level for the stock.
Disclaimer
This article has been prepared by Kalkine Media, echoed on the website kalkinemedia.com/au and associated pages, based on the information obtained and collated from the subscription reports prepared by Kalkine Pty. Ltd. [ABN 34 154 808 312; AFSL no. 425376] on Kalkine.com.au (and associated pages). The principal purpose of the content is to provide factual information only for educational purposes. None of the content in this article, including any news, quotes, information, data, text, reports, ratings, opinions, images, photos, graphics, graphs, charts, animations, and video is or is intended to be, advisory in nature. The content does not contain or imply any recommendation or opinion intended to influence your financial decisions, including but not limited to, in respect of any particular security, transaction, or investment strategy, and must not be relied upon by you as such. The content is provided without any express or implied warranties of any kind. Kalkine Media, and its related bodies corporate, agents, and employees (Kalkine Group) cannot and do not warrant the accuracy, completeness, timeliness, merchantability, or fitness for a particular purpose of the content or the website, and to the extent permitted by law, Kalkine Group hereby disclaims any and all such express or implied warranties. Kalkine Group shall NOT be held liable for any investment or trading losses you may incur by using the information shared on our website.
