_06_30_2023_09_48_49_431348.jpg)


Highlights
- HMC Capital’s revenue jumped 203% YoY to AUD 272.3 million in H1FY25, driven by a 209% rise in fund management fees and 179% increase in investment income.
- Operating earnings after tax more than doubled to AUD 140.5 million, while Assets Under Management (AUM) surged 45%.
- Despite revising FY25 pre-tax EPS guidance from 70 to 66 cents, HMC highlighted strategic moves including an AUD 4.3 billion infrastructure REIT launch and an AUD 950 million renewable energy acquisition.
HMC Capital Limited (ASX:HMC) is a diversified alternative asset manager listed on the ASX That specialises in high-conviction, scalable real asset strategies, HMC manages investments on behalf of individuals, large institutions, and superannuation funds. In the six months ended 31 December 2024 (H1FY25), the company recorded a 203% YoY increase in revenue, reaching AUD 272.3 million, up from AUD 89.9 million in the previous corresponding period. This surge was driven by a 209% rise in fund management fees and a 179% jump in investment income.
During the reported period, the company's operating earnings after tax rose sharply to AUD 140.5 million, more than doubling from AUD 57.8 million in H1FY24. Over the same period, assets under management (AUM) expanded by 45% from June 2024 levels, propelled by active investments in HMC’s Digital Infrastructure, Energy Transition, and Private Credit divisions.
Revised FY25 Outlook
On 6 May 2025, HMC Capital announced a revision to its FY25 earnings guidance. The company’s annualised operating EPS (pre-tax) is now tracking at 66 cents, slightly lower than the 70 cents previously forecast on 1 April. This downward adjustment reflects fair value movements in holdings across HMCCP and other financial assets during April 2025.
Despite the EPS revision, dividend guidance remains unchanged at 12 cents per share for FY25. HMC also highlighted the strategic significance of two major recent developments: the AUD 4.3 billion DigiCo Infrastructure REIT launch and the AUD 950 million acquisition of Neoen Victoria renewable assets. Meanwhile, the real estate division is projected to contribute an additional AUD 2.5 billion in AUM, further expanding HMC’s investment footprint.
Macroeconomic Trends
According to data released by the Australian Bureau of Statistics (ABS) on 21 May 2025, total wages and salaries paid by employers rose 5.8% YoY to AUD 104.8 billion in the March quarter. On a quarterly basis, wages were up 1.1%.
Additionally, the Reserve Bank of Australia (RBA) cut the cash rate by 25 basis points on 20 May and is widely expected to reduce rates by another 50 basis points in 2025. Combined with rising wages, these moves are expected to improve liquidity and sentiment across the financial sector.
Stock Performance of HMC
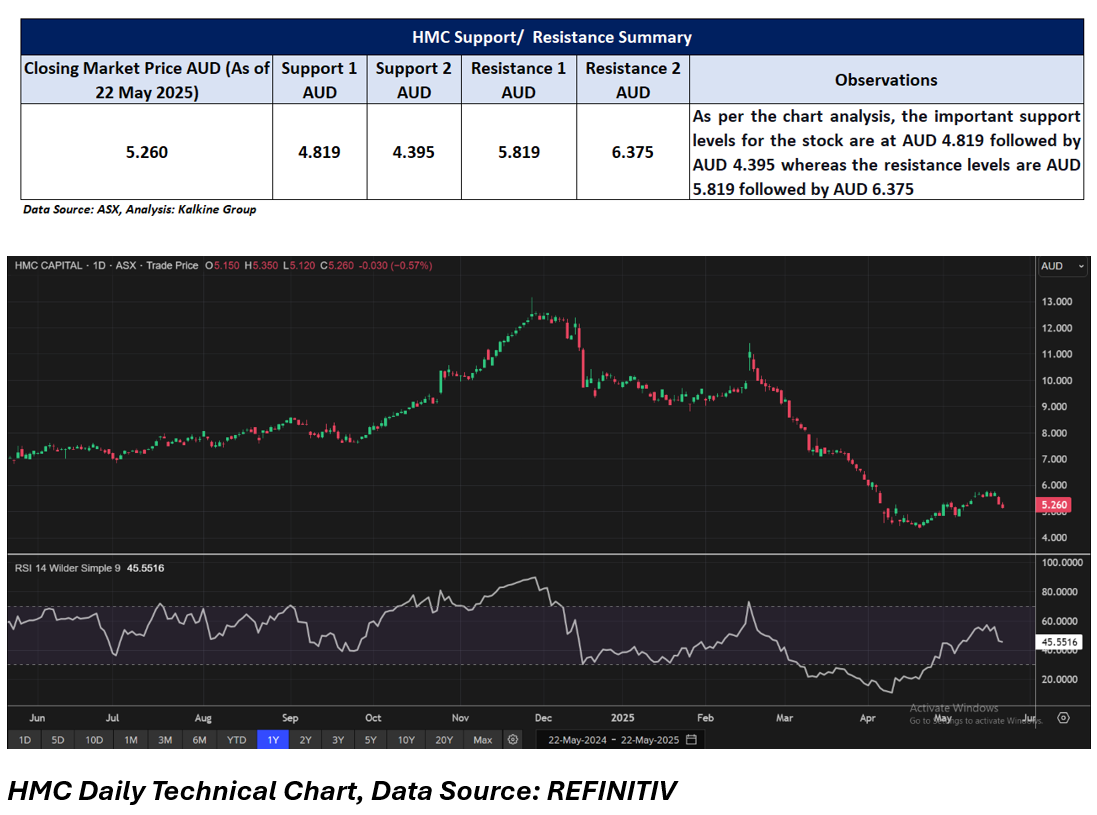
HMC shares closed 0.57% lower at AUD 5.26 per share on 22 May 2025. The stock price has lost almost 25.39% in a year and has jumped 19.27% in a month.
52-week high of HMC is AUD 13.16, recorded on 27 November 2024 and 52-week low is AUD 4.34, recorded on 22 April 2025.
Support and Resistance Summary
Note 1: Past performance is neither an Indicator nor a guarantee of future performance.
Note 2: The reference date for all price data, and currency, is 22 May 2025. The reference data in this report has been partly sourced from EODHD/Others.
Technical Indicators Defined:
Support: A level at which the stock prices tend to find support if they are falling, and a downtrend may take a pause backed by demand or buying interest. Support 1 refers to the nearby support level for the stock and if the price breaches the level, then Support 2 may act as the crucial support level for the stock.
Resistance: A level at which the stock prices tend to find resistance when they are rising, and an uptrend may take a pause due to profit booking or selling interest. Resistance 1 refers to the nearby resistance level for the stock and if the price surpasses the level, then Resistance 2 may act as the crucial resistance level for the stock.
Disclaimer
This article has been prepared by Kalkine Media, echoed on the website kalkinemedia.com/au and associated pages, based on the information obtained and collated from the subscription reports prepared by Kalkine Pty. Ltd. [ABN 34 154 808 312; AFSL no. 425376] on Kalkine.com.au (and associated pages). The principal purpose of the content is to provide factual information only for educational purposes. None of the content in this article, including any news, quotes, information, data, text, reports, ratings, opinions, images, photos, graphics, graphs, charts, animations, and video is or is intended to be, advisory in nature. The content does not contain or imply any recommendation or opinion intended to influence your financial decisions, including but not limited to, in respect of any particular security, transaction, or investment strategy, and must not be relied upon by you as such. The content is provided without any express or implied warranties of any kind. Kalkine Media, and its related bodies corporate, agents, and employees (Kalkine Group) cannot and do not warrant the accuracy, completeness, timeliness, merchantability, or fitness for a particular purpose of the content or the website, and to the extent permitted by law, Kalkine Group hereby disclaims any and all such express or implied warranties. Kalkine Group shall NOT be held liable for any investment or trading losses you may incur by using the information shared on our website.
