


Highlights
- GQG FY24 net revenue increased by 46.91% YoY to USD 760.4 million, primarily driven by an increase in net inflows.
- The company reported Funds Under Management (FUM) of USD 148.2 billion in FY24, and as of 30 April 2025, it stood at USD 163.6 billion.
- GQG's operating income rose 50.4% YoY to USD 577.9 million in FY24.
GQG Partners Inc. (ASX:GQG) is a U.S.-headquartered global asset manager specialising in active equity portfolios for institutional and wholesale clients.
In the financial year 2024 (FY24), the company’s net revenue increased by 46.91% YoY to USD 760.4 million and net inflows nearly doubled to USD 20.2 billion over previous corresponding period. FUM rose by 99.6% YoY to USD 148.2 billion in FY24, up from USD 101.9 billion in FY23. GQG’s operating income increased by 50.4% YoY to USD 577.9 million, up from USD 384.4 million in FY23.
Recent Business Update
Through an ASX update dated 9 May 2025, the company informed that its FUM stands at USD 163.6 billion as of 30 April 2025, compared to USD 161.8 billion in previous month. In April 2025, the company recorded net inflows of USD 1.4 billion. With this, net inflows stood at USD 6 billion on a YTD basis.
Company Outlook
GQG maintains a competitive advantage through its cost-effective fee structure, with a weighted average management fee of 49.6 basis points. This relatively lower fee level helps shield the company from the broader industry’s margin pressures, particularly when compared to peers with higher-cost models. Notably, over 96% of GQG’s revenue is generated from asset-based fees, ensuring a consistent and largely predictable income stream.
Looking ahead, the company holds a cautiously optimistic view for FY25, despite ongoing macroeconomic challenges, global trade tensions, regulatory shifts, and evolving investor preferences. Management remains confident in the long-term outlook, supported by its business fundamentals and improved investment performance.
Top 10 Shareholders of GQG
The top 10 shareholders of GQG have ~76.91% of the total shareholding. Jain (Rajiv) and Carver (Timothy) have the highest stakes in the company with the shareholding of ~70.20% and 3.75%, respectively.
Share performance of GQG
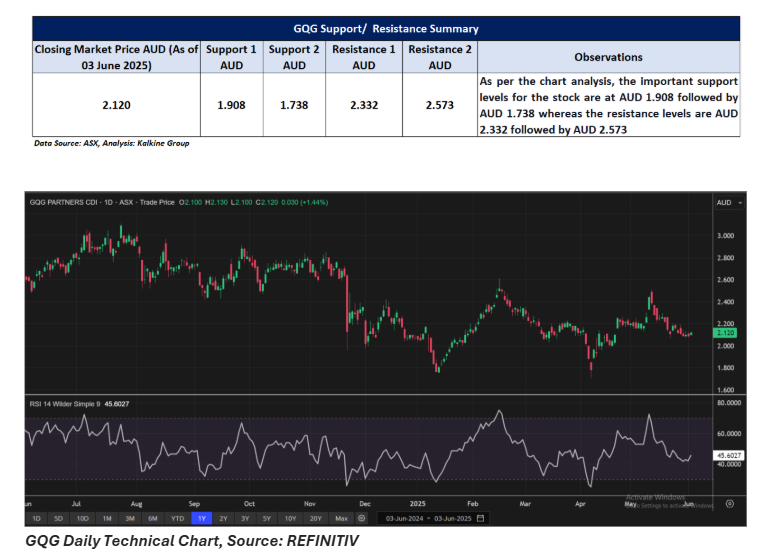
GQG edged up by 1.44% on 2 June 2025 to close at AUD 2.12 per share. Over the last nine months, the stock has declined by 22.63%. However, it has seen a modest rebound of 2.42% year-to-date and gained 1.44% over the past six months. GQG touched its 52-week high of AUD 3.11 on 24 July 2024, and its 52-week low of AUD 1.71 was recorded on 7 April 2025.
Support and Resistance Summary
Note 1: Past performance is neither an Indicator nor a guarantee of future performance.
Note 2: The reference date for all price data, and currency, is 03 June 2025. The reference data in this report has been partly sourced from EODHD/Others.
Technical Indicators Defined:
Support: A level at which the stock prices tend to find support if they are falling, and a downtrend may take a pause backed by demand or buying interest. Support 1 refers to the nearby support level for the stock and if the price breaches the level, then Support 2 may act as the crucial support level for the stock.
Resistance: A level at which the stock prices tend to find resistance when they are rising, and an uptrend may take a pause due to profit booking or selling interest. Resistance 1 refers to the nearby resistance level for the stock and if the price surpasses the level, then Resistance 2 may act as the crucial resistance level for the stock.
Disclaimer
This article has been prepared by Kalkine Media, echoed on the website kalkinemedia.com/au and associated pages, based on the information obtained and collated from the subscription reports prepared by Kalkine Pty. Ltd. [ABN 34 154 808 312; AFSL no. 425376] on Kalkine.com.au (and associated pages). The principal purpose of the content is to provide factual information only for educational purposes. None of the content in this article, including any news, quotes, information, data, text, reports, ratings, opinions, images, photos, graphics, graphs, charts, animations, and video is or is intended to be, advisory in nature. The content does not contain or imply any recommendation or opinion intended to influence your financial decisions, including but not limited to, in respect of any particular security, transaction, or investment strategy, and must not be relied upon by you as such. The content is provided without any express or implied warranties of any kind. Kalkine Media, and its related bodies corporate, agents, and employees (Kalkine Group) cannot and do not warrant the accuracy, completeness, timeliness, merchantability, or fitness for a particular purpose of the content or the website, and to the extent permitted by law, Kalkine Group hereby disclaims any and all such express or implied warranties. Kalkine Group shall NOT be held liable for any investment or trading losses you may incur by using the information shared on our website.
