


Highlights
- Besra Gold Inc. (ASX:BEZ) is a Malaysia-based gold mining company focused on the exploration and development of the Bau Goldfield in East Malaysia
- BEZ shares have been rising over the last one month, and are up over 300% in the same time frame
- Will the ongoing rally in BEZ shares continue further? Here’s a technical view
Besra Gold Inc. (ASX:BEZ), which holds nearly 92% stake (directly or indirectly) in the Bau Goldfield, is on a roll. Shares of this yellow metal producer have soared over 300% in the last month, rising from AU$ 0.60 on 21 March 2023 to AU$ 0.257 as on 20 April 2023.
The rally in the shares of the gold producer started on 23 March 2023, after the company announced securing funding up to US$300 million on 21 March to bring its Bau gold project to production in East Malaysia. On 23 March itself, BEZ shares ended 80% higher. As per the company, the funding was one of the largest financings of its kind undertaken by any company listed on ASX. The company said the funding agreement provides a clear path to gold production.
The stock saw a further up move of 40% on 30 March after the company announced final assay results of the 2022 drilling program, which strengthened Bekajang’s gold mineralisation potential. The stock touched a 52-week high price of AU$ 0.28 on 13 April 2023.
Will BEZ shares rally further? Let’s analyse the technical chart of Besra Gold Inc. to get a view of where the gold stock is heading.
Besra Gold Inc. (ASX:BEZ) Technical Analysis
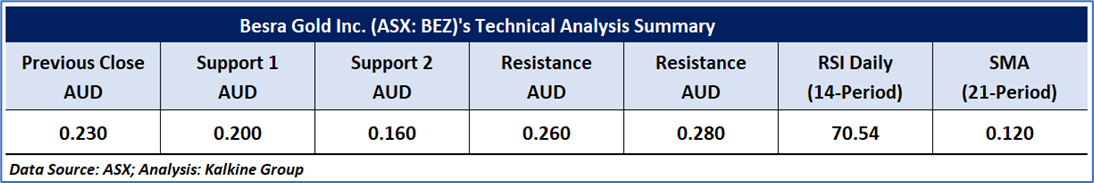
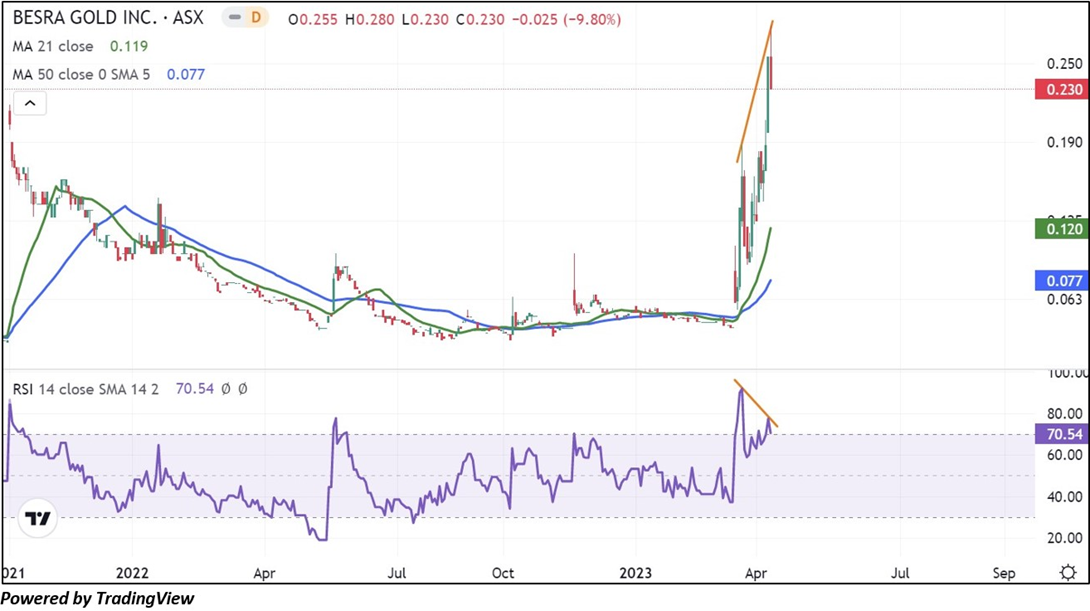
On the daily chart, while in a short-term rally, BEZ's stock price is forming a negative divergence compared to the RSI (14-period), it indicates that the price might see a correction soon. Furthermore, the stated indicator, with a value of 70.54, began to move southward from the overbought zone, supporting the negative bias. However, prices are trading above the trend-following indicators 21-period and 50-period SMAs, which might function as support levels for the stock. The stock's main support level is AUD 0.200, while the major resistance level is AUD 0.260.
Daily Technical Chart – BEZ
The support and resistance levels were evaluated as per the closing price of AUD 0.230 per share of 13 April 2023, down by 9.80%.
Technical Indicators Defined:
Support: A level at which the stock prices tend to find support if they are falling, and a downtrend may take a pause backed by demand or buying interest. Support 1 refers to the nearby support level for the stock, and if the price breaches the level, then Support 2 may act as the crucial support level for the stock.
Resistance: A level at which the stock prices tend to find resistance when they are rising, and an uptrend may take a pause due to profit booking or selling interest. Resistance 1 refers to the nearby resistance level for the stock and if the price surpasses the level, then Resistance 2 may act as the crucial resistance level for the stock.
Stop-loss: It is a level to protect further losses in case of unfavourable movement in the stock prices.
The Green colour line reflects the 21-period moving average. SMA helps to identify existing price trends. If the prices are trading above the 21-period, prices are currently in a bullish trend (Vice – Versa).
The Blue colour line reflects the 50-period moving average. SMA helps to identify existing price trends. If the prices are trading above the 50-period, prices are currently in a bullish trend (Vice – Versa).
The Orange/ Yellow colour line represents the Trendline.
The Purple colour line in the chart’s lower segment reflects the Relative Strength Index (14-Period), which indicates price momentum and signals momentum in trend. A reading of 70 or above suggests overbought status, while a reading of 30 or below suggests an oversold status.
Disclaimer
This article has been prepared by Kalkine Media, echoed on the website kalkinemedia.com/au and associated pages, based on the information obtained and collated from the subscription reports prepared by Kalkine Pty. Ltd. [ABN 34 154 808 312; AFSL no. 425376] on Kalkine.com.au (and associated pages). The principal purpose of the content is to provide factual information only for educational purposes. None of the content in this article, including any news, quotes, information, data, text, reports, ratings, opinions, images, photos, graphics, graphs, charts, animations, and video is or is intended to be, advisory in nature. The content does not contain or imply any recommendation or opinion intended to influence your financial decisions, including but not limited to, in respect of any particular security, transaction, or investment strategy, and must not be relied upon by you as such. The content is provided without any express or implied warranties of any kind. Kalkine Media, and its related bodies corporate, agents, and employees (Kalkine Group) cannot and do not warrant the accuracy, completeness, timeliness, merchantability, or fitness for a particular purpose of the content or the website, and to the extent permitted by law, Kalkine Group hereby disclaims any and all such express or implied warranties. Kalkine Group shall NOT be held liable for any investment or trading losses you may incur by using the information shared on our website.
