


Highlights
- NDO’s revenue from ordinary activities rose 75.2% YoY to AUD 163.63 million in FY24, up from AUD 93.37 million in FY23.
- The company recorded Service EBITDA of AUD 42.27 million in FY24, compared to a loss of AUD 2.66 million in FY23.
- Nido Education achieved a 40% YoY increase in Service EBITDA in January 2025.
Nido Education Limited (ASX:NDO) is an Australian company that offers long-term early childhood education and care services under the Nido Early School brand, providing programs for children aged six weeks to school age in a nurturing and secure environment.
In the financial year 2024 (FY24), the company’s revenue from ordinary activities rose 75.2% YoY to AUD 163.63 million, up from AUD 93.37 million in FY23, primarily driven by an 81% YoY increase in service revenue during the period. In FY24, service EBITDA surged to AUD 42.27 million, compared to a loss of AUD 2.66 million in FY23. Consequently, statutory profit from ordinary activities after tax turned positive to AUD 14.65 million in FY24, compared to a loss of AUD 18.11 million in FY23.
During the reported period, NDO’s net income margin reached 9%, compared to negative 18.9% in the previous corresponding period.
Nido recorded a 40% YoY increase in Service EBITDA in January 2025. However, enrolments were subdued in February 2025.
Company Outlook
Nido enters 2025 with a strategic focus on adaptability, recognising shifts in the early education sector and the need to move beyond previously successful models. With bipartisan political support for increased investment, the outlook remains positive. However, persistent cost-of-living pressures may impact families' ability to commit to enrolments, reinforcing the importance of flexible, responsive operations.
Recent changes to the Australian Government’s childcare subsidy activity test are expected to ease access and reduce financial barriers, offering further support for families navigating these challenges.
Business Update
In late February 2025, the company announced the commencement of an AUD 5 million on-market share buy-back campaign. The company plans to fund this campaign through its current debt facilities and cash it generates every month.
Share performance of NDO
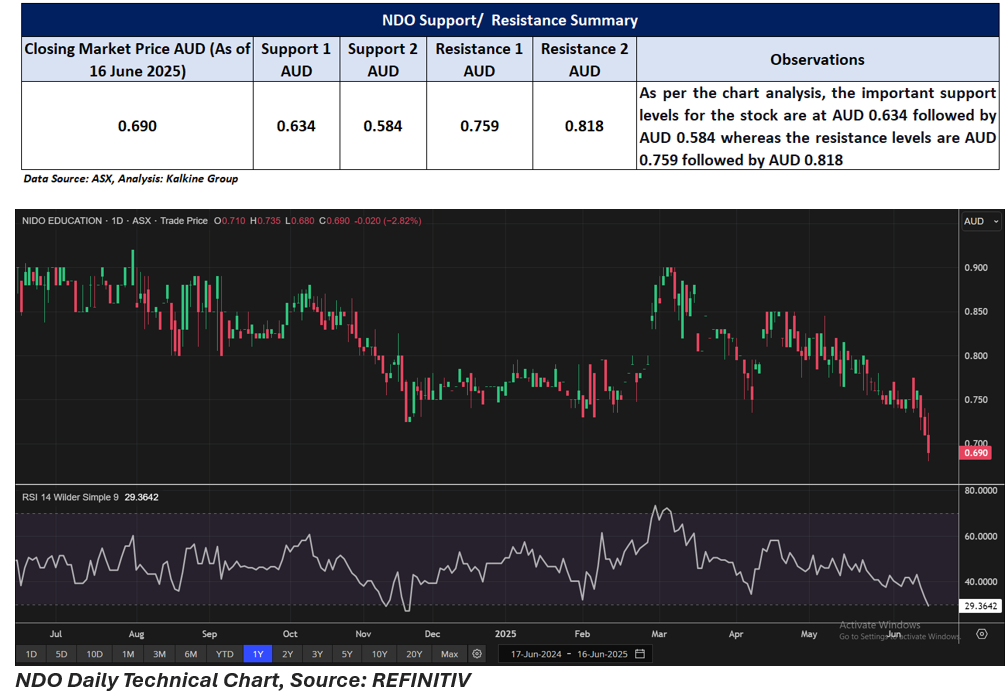
NDO ended Monday’s session at AUD 0.69, marking a 2.82% drop intraday. The stock has declined 8% in a week and 12.10% for the month. It continues a broader downtrend, falling 21.59% over the past three months and 10.39% over six months. The stock is down 9.80% on a YTD basis.
52-week high of NDO is AUD 0.92, recorded on 31 July 2024, and 52-week low is AUD 0.71, recorded on 13 June 2025.
Support and Resistance Summary
Note 1: Past performance is neither an Indicator nor a guarantee of future performance.
Note 2: The reference date for all price data, and currency, is 16 June 2025. The reference data in this report has been partly sourced from EODHD/Others.
Technical Indicators Defined:
Support: A level at which the stock prices tend to find support if they are falling, and a downtrend may take a pause backed by demand or buying interest. Support 1 refers to the nearby support level for the stock and if the price breaches the level, then Support 2 may act as the crucial support level for the stock.
Resistance: A level at which the stock prices tend to find resistance when they are rising, and an uptrend may take a pause due to profit booking or selling interest. Resistance 1 refers to the nearby resistance level for the stock and if the price surpasses the level, then Resistance 2 may act as the crucial resistance level for the stock.
Disclaimer
This article has been prepared by Kalkine Media, echoed on the website kalkinemedia.com/au and associated pages, based on the information obtained and collated from the subscription reports prepared by Kalkine Pty. Ltd. [ABN 34 154 808 312; AFSL no. 425376] on Kalkine.com.au (and associated pages). The principal purpose of the content is to provide factual information only for educational purposes. None of the content in this article, including any news, quotes, information, data, text, reports, ratings, opinions, images, photos, graphics, graphs, charts, animations, and video is or is intended to be, advisory in nature. The content does not contain or imply any recommendation or opinion intended to influence your financial decisions, including but not limited to, in respect of any particular security, transaction, or investment strategy, and must not be relied upon by you as such. The content is provided without any express or implied warranties of any kind. Kalkine Media, and its related bodies corporate, agents, and employees (Kalkine Group) cannot and do not warrant the accuracy, completeness, timeliness, merchantability, or fitness for a particular purpose of the content or the website, and to the extent permitted by law, Kalkine Group hereby disclaims any and all such express or implied warranties. Kalkine Group shall NOT be held liable for any investment or trading losses you may incur by using the information shared on our website.
