


Highlights
- Newmont Corporation sold its Akyem operations in Ghana for USD 1 billion as part of non-core asset divestment strategy.
- In Q3 FY24, Newmont recorded a 483.5% YoY increase in net income to USD 922 million, driven by higher gold prices and sales volume.
- Newmont targets gold production of 1.8 million ounces in the next quarter, aiming for a total of 6.75 million ounces in FY24.
Newmont Corporation (ASX:NEM) is a gold mining firm with operations focused in Australia, Africa, South and North America. Along with gold production, the company is engaged in the production of zinc, lead, silver and copper. In February 2024, the company announced its non-core asset divestment strategy which will help in focusing on Tier 1 assets. In line with this strategy, on 9 October 2024, the company executed an agreement to sell its Akyem operations in Ghana for consideration of USD 1 billion. The transaction is anticipated to be completed in 4Q 2024, subject to regulatory approvals and fulfillment of standard conditions.
The company informed that the sale of Havireon JV, Telfer and Akyem are expected to generate gross proceeds of up to USD 1.5 billion.
Financial performance of NEM
In the quarter ending 30 September 2024 (3QFY24), the company recorded 483.5% YoY increase in net income to USD 922 million, driven by increase in sales volume and gold prices, offset by several factors, including increase in production costs.
During the reported period, gold production jumped 4% QoQ on the back of higher production at Cerro negro and increase in throughput at Ahafo and Brucejack. The period saw 84.7% YoY increase in sales revenue to USD 4,605 million and over 110% rise in adjusted EBITDA to USD 1,967 million.
Outlook
In the next quarter, the company targets gold production of 1.8 million ounces at an AISC of USD 1,475 per ounce, supported by improved grades at Tanami and Penasquito, gains from Nevada gold mines and enhanced throughput at Lihir. Furthermore, NEM is on track to achieve production guidance of 6.75 million ounces in FY24.
To boost long-term production capabilities, the company intends to invest in its Tier 1 assets.
Share performance of NEM
NEM shares closed 1.94% higher at AUD 74.01 apiece on 29 October 2024 with a market cap of AUD 83.03 billion. Over the past year, the share price has increased by 20.66%, while in the three months, it has increased by 2.45%.
52-week high of NEM is AUD 87.57, recorded on 23 October 2024 and 52-week low is AUD 45.30, recorded on 28 February 2024.
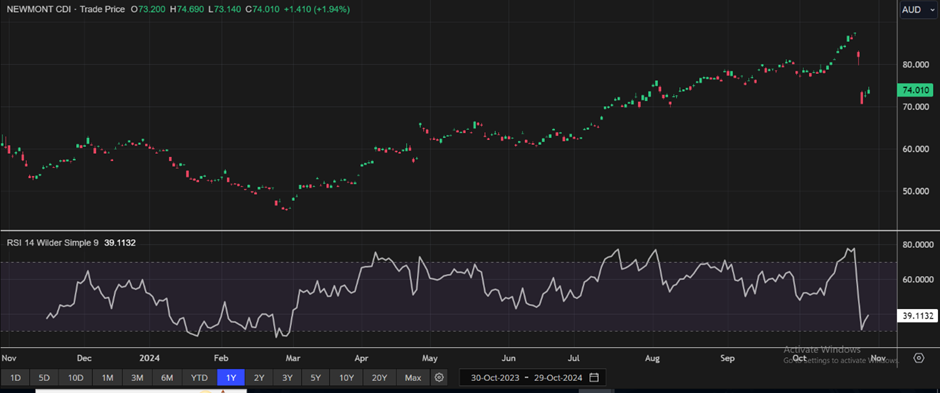
NEM Daily Technical Chart, Source: EODHD/Others
Note 1: Past performance is neither an Indicator nor a guarantee of future performance.
Note 2: The reference date for all price data, and currency, is 29 October 2024. The reference data in this report has been partly sourced from EODHD/Others.
Disclaimer
This article has been prepared by Kalkine Media, echoed on the website kalkinemedia.com/au and associated pages, based on the information obtained and collated from the subscription reports prepared by Kalkine Pty. Ltd. [ABN 34 154 808 312; AFSL no. 425376] on Kalkine.com.au (and associated pages). The principal purpose of the content is to provide factual information only for educational purposes. None of the content in this article, including any news, quotes, information, data, text, reports, ratings, opinions, images, photos, graphics, graphs, charts, animations, and video is or is intended to be, advisory in nature. The content does not contain or imply any recommendation or opinion intended to influence your financial decisions, including but not limited to, in respect of any particular security, transaction, or investment strategy, and must not be relied upon by you as such. The content is provided without any express or implied warranties of any kind. Kalkine Media, and its related bodies corporate, agents, and employees (Kalkine Group) cannot and do not warrant the accuracy, completeness, timeliness, merchantability, or fitness for a particular purpose of the content or the website, and to the extent permitted by law, Kalkine Group hereby disclaims any and all such express or implied warranties. Kalkine Group shall NOT be held liable for any investment or trading losses you may incur by using the information shared on our website.
