


Highlights
- MTS’ sales revenue climbed 8.1% YoY in 1HFY25, supported by acquisitions and sectoral growth.
- Metcash aims for AUD 15 million in annualised savings through efficiency measures.
- In the first four weeks of 2HFY25, MTS recorded an 8.0% YoY increase in total sales.
Metcash Limited (ASX:MTS) is an Australian wholesale distribution and marketing giant. The diversified business model of MTS helps it navigate market complexities, with opportunities emerging in both the food and liquor sectors. The recent acquisition of Superior Foods has strengthened the food pillar and has contributed to market share expansion and revenue growth. Synergies from these transactions enhances cost management and operational efficiencies.
Similarly, the liquor segment benefits from the IBA network's localised offerings, driving market share gains.
Metcash is actively pursuing operational efficiencies, targeting AUD 15 million in annualised cost savings through supplier negotiations and improved cash flow management.
Recent financial performance
For the half-year ended 31 October 2024 (1HFY25), Metcash reported an 8.1% YoY increase in sales revenue, reaching AUD 8,470.9 million. Meanwhile, net profit rose marginally by 0.6% YoY to AUD 141.8 million, despite higher finance costs reducing underlying profit after tax by 5.5% YoY. Cash and cash equivalents dipped slightly by 1.9% YoY.
During the reported period, group revenue (including charge-through sales) jumped 6.3% YoY, supported growth across liquor, food and hardware pillars and partly assisted by acquisitions.
In the first four weeks of 2HFY25, MTS recorded an 8.0% YoY increase in total sales. Food sales surged by 22.6% YoY (excluding tobacco), supported by a 2.9% YoY rise in supermarket sales and a 6.1% YoY boost from the acquisition of Superior Foods.
During the reported period, liquor sales grew by 4.4% YoY, with IBA retail and contract customer sales climbing 5.0% YoY. Meanwhile, hardware performance was mixed — IHG sales rose 3.6% YoY, and total tools saw a 2.6% YoY uptick over the first three weeks.
Share performance of MTS
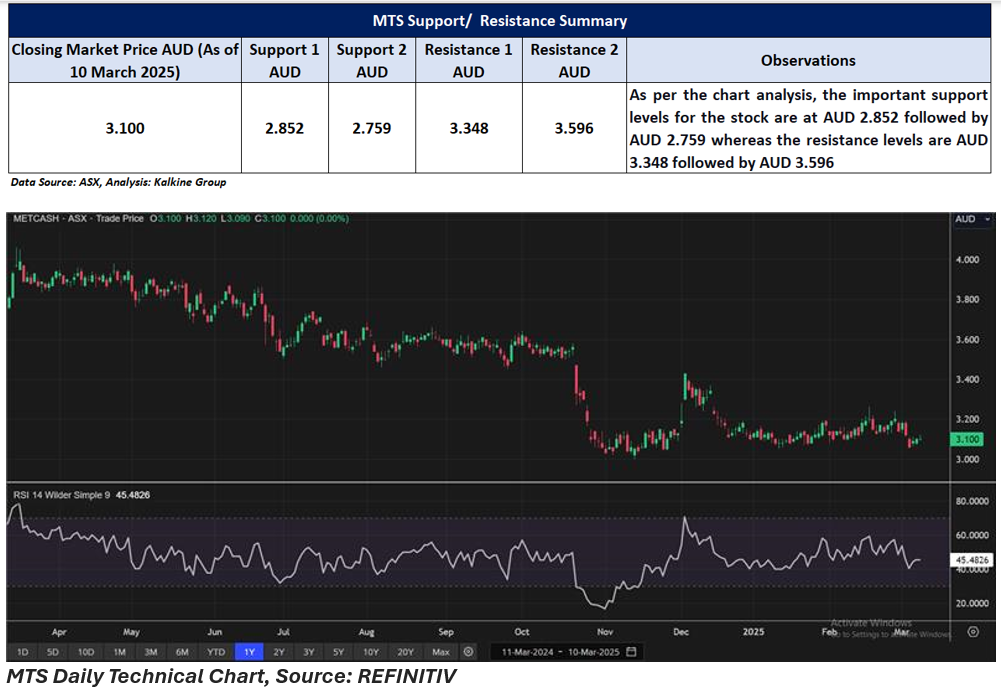
MTS shares closed at AUD 3.10 per share on 10 March 2025. Over the past year, the share price has dropped by almost 17.90%, while in the last three months, it has declined by 5.20%.
52-week high of MTS is AUD 4.06, recorded on 13 March 2024 and 52-week low is AUD 3.00, recorded on 13 November 2024.
Support and Resistance Summary
Note 1: Past performance is neither an Indicator nor a guarantee of future performance.
Note 2: The reference date for all price data, and currency, is 10 March 2025. The reference data in this report has been partly sourced from EODHD/Others.
Technical Indicators Defined:
Support: A level at which the stock prices tend to find support if they are falling, and a downtrend may take a pause backed by demand or buying interest. Support 1 refers to the nearby support level for the stock and if the price breaches the level, then Support 2 may act as the crucial support level for the stock.
Resistance: A level at which the stock prices tend to find resistance when they are rising, and an uptrend may take a pause due to profit booking or selling interest. Resistance 1 refers to the nearby resistance level for the stock and if the price surpasses the level, then Resistance 2 may act as the crucial resistance level for the stock.
Disclaimer
This article has been prepared by Kalkine Media, echoed on the website kalkinemedia.com/au and associated pages, based on the information obtained and collated from the subscription reports prepared by Kalkine Pty. Ltd. [ABN 34 154 808 312; AFSL no. 425376] on Kalkine.com.au (and associated pages). The principal purpose of the content is to provide factual information only for educational purposes. None of the content in this article, including any news, quotes, information, data, text, reports, ratings, opinions, images, photos, graphics, graphs, charts, animations, and video is or is intended to be, advisory in nature. The content does not contain or imply any recommendation or opinion intended to influence your financial decisions, including but not limited to, in respect of any particular security, transaction, or investment strategy, and must not be relied upon by you as such. The content is provided without any express or implied warranties of any kind. Kalkine Media, and its related bodies corporate, agents, and employees (Kalkine Group) cannot and do not warrant the accuracy, completeness, timeliness, merchantability, or fitness for a particular purpose of the content or the website, and to the extent permitted by law, Kalkine Group hereby disclaims any and all such express or implied warranties. Kalkine Group shall NOT be held liable for any investment or trading losses you may incur by using the information shared on our website.
