Highlights
- MGH reported a 13.62% YoY revenue growth in FY24, reaching AUD 908.52 million.
- In FY24, MGH’s EBITDA rose by 27% and NPAT increased by 22.27%.
- Board approved a share buyback of up to 10% of outstanding shares over the next 12 months.
Mass Group Holdings Limited (ASX:MGH) is an ASX-listed company that specialises in construction materials, equipment, and services across the civil and infrastructure industries.
According to the latest dwelling approvals data from the Australian Bureau of Statistics (ABS), the total number of dwellings approved in December 2024 increased by 0.7% to 15,174, rebounding from a 3.4% decline in November. This signals potential stability in the construction sector.
Despite a 3.0% decline in private sector housing approvals to 8,715, private sector dwellings (excluding houses) surged by 15.2% to 6,209. Additionally, the value of non-residential buildings grew 9.7%, reaching AUD 6.62 billion. This data suggests continued strength in engineering and construction stocks, aligning with MGH's strategic positioning in these markets.
MGH’s Financial Performance in FY24
In FY24, MGH reported a 13.62% YoY increase in revenue, reaching AUD 908.52 million in FY24, compared to AUD 799.64 million in FY23. This growth was fuelled by strong performances across its construction materials, civil construction, and real estate segments. Notably, the company’s underlying EBITDA rose 27% YoY to AUD 207.26 million in FY24, while underlying NPAT saw a 22.27% increase, reaching AUD 84.27 million.
Recent business update
On 3 February 2025, MGH announced that its Board of Directors approved an on-market share buyback of up to 10% of its outstanding ordinary shares over the next 12 months.
Outlook
The company projected underlying EBITDA for FY25 to range between AUD 215 million and AUD 245 million. The capital recycling program is expected to generate over AUD 100 million in cash during the fiscal year.
Key Positives of MGH
- Higher Gross Margin: Increased from 50.8% in FY23 to 58.7% in FY24.
- Improved Return on Equity: Rose to 5.9%, surpassing the industry median of 4.6%.
Key Negatives of MGH
- Declining Asset Turnover Ratio: Dropped from 0.32x in FY23 to 0.28x in FY24.
- Lower Quick Ratio: Decreased from 1.07x in FY23 to 0.99x in FY24, reflecting potential liquidity challenges.
Share performance of MGH
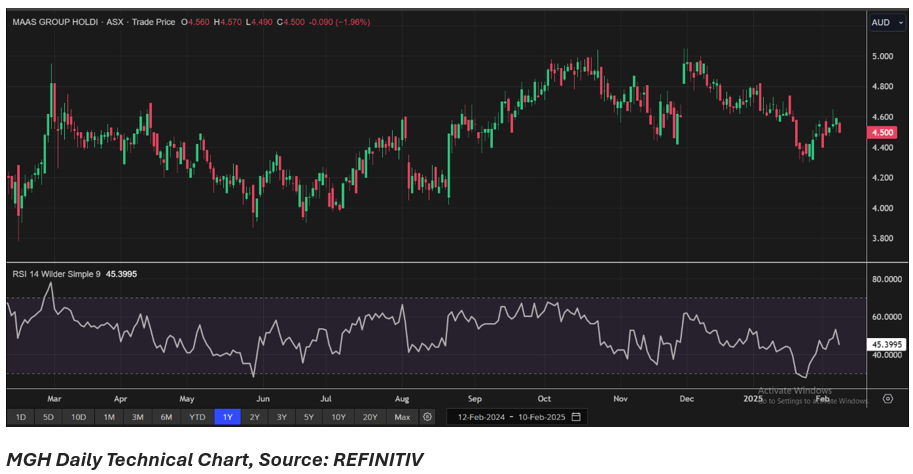
MGH shares closed 1.96% lower at AUD 4.50 per share on 10 February 2025. Over the past year, MGH’s share price has gained nearly 6.64% and in the last three months, it has dropped by almost 3.64%.
52-week high of MGH is AUD 5.05, recorded on 2 December 2024 and 52-week low is AUD 3.78, recorded on 15 February 2024.

Note 1: Past performance is neither an Indicator nor a guarantee of future performance.
Note 2: The reference date for all price data, and currency, is 10 February 2025. The reference data in this report has been partly sourced from REFINITIV.
Disclaimer
This article has been prepared by Kalkine Media, echoed on the website kalkinemedia.com/au and associated pages, based on the information obtained and collated from the subscription reports prepared by Kalkine Pty. Ltd. [ABN 34 154 808 312; AFSL no. 425376] on Kalkine.com.au (and associated pages). The principal purpose of the content is to provide factual information only for educational purposes. None of the content in this article, including any news, quotes, information, data, text, reports, ratings, opinions, images, photos, graphics, graphs, charts, animations, and video is or is intended to be, advisory in nature. The content does not contain or imply any recommendation or opinion intended to influence your financial decisions, including but not limited to, in respect of any particular security, transaction, or investment strategy, and must not be relied upon by you as such. The content is provided without any express or implied warranties of any kind. Kalkine Media, and its related bodies corporate, agents, and employees (Kalkine Group) cannot and do not warrant the accuracy, completeness, timeliness, merchantability, or fitness for a particular purpose of the content or the website, and to the extent permitted by law, Kalkine Group hereby disclaims any and all such express or implied warranties. Kalkine Group shall NOT be held liable for any investment or trading losses you may incur by using the information shared on our website.


