


Highlights
- Iluka Resources reported FY24 revenue of AUD 1,129 million, down 8.8% YoY, but maintained an EBITDA margin of 42%.
- In FY24, capital expenditure surged by 54.45% YoY to AUD 434 million.,
- The Balranald is set for commissioning in 2025, and the Eneabba rare earths refinery is planned for 2027.
- Despite a 35.99% annual share price decline, Iluka increased its fully franked dividend by 14.29% to 8 cents per share.
Iluka Resources Ltd (ASX:ILU), an Australian-based international mineral sands company, reported mineral sands revenue of AUD 1,129 million in the financial year 2024 (FY24), reflecting an 8.8% YoY decline from AUD 1,238 million in FY23. Despite the revenue dip, Iluka achieved an EBITDA margin of 42%, with a net profit after tax (NPAT) of AUD 231 million.
In FY24, capital expenditure surged by 54.45% YoY to AUD 434 million. During the reported period, the company made investments in growth projects like the Balranald and Eneabba developments.
Iluka increased its full-year total dividend to 8 cents per share (fully franked), marking a 14.29% rise from the previous year’s dividend of 7 cents.
Outlook and Strategic Projects
The Balranald project is expected to be commissioned in the second half of 2025 and is anticipated to contribute 60ktpa of rutile, 50ktpa of zircon, and synthetic rutile feedstock. The Eneabba rare earths refinery is fully funded, with commissioning scheduled for 2027, while the Wimmera project is progressing through its DFS, targeting completion by mid-2026.
Capital expenditure guidance for 2025 is set at AUD 480 million, with AUD 380 million allocated to Balranald, and AUD 10 million each for Wimmera and Tutunup. Additionally, Eneabba’s refinery construction is expected to incur AUD 600 million in 2025 as development accelerates.
Industry Dynamics and Demand
Despite some late-2024 price pressures, zircon pricing is projected to stay resilient, and titanium feedstock demand is anticipated to strengthen through 2025. Global pigment markets are showing early signs of recovery, providing a favorable demand backdrop for Iluka’s products.
Key Business Update: Goschen South Mineral Resource Estimate
In February 2025, Iluka announced its first Mineral Resource Estimate (MRE) for the Goschen South deposit in Australia. The deposit contains 630 million tonnes (Mt) at 3.7% heavy minerals (HM), equating to 24 Mt of HM, classified as indicated and inferred resources under the JORC Code (2012 Edition).
The deposit spans 10.5 km by 6 km, with an average mineralised thickness of 6.5m beneath 13.5m–25m of overburden.
Share performance of ILU
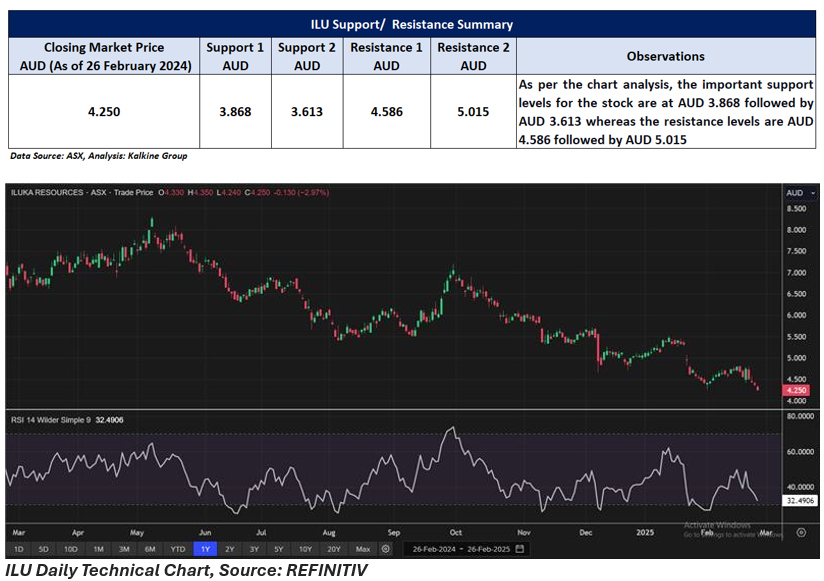
ILU shares closed 2.97% lower at AUD 4.25 per share on 26 February 2025. Over the past year, ILU’s share price has dropped by nearly 35.99% and in the last three months, it has decreased by almost 23.42%.
52-week high of ILU is AUD 8.31, recorded on 8 May 2024 and 52-week low is AUD 4.27, recorded on 3 February 2025.
Support and Resistance Summary
Note 1: Past performance is neither an Indicator nor a guarantee of future performance.
Note 2: The reference date for all price data, and currency, is 26 February 2025. The reference data in this report has been partly sourced from EODHD/Others.
Technical Indicators Defined:
Support: A level at which the stock prices tend to find support if they are falling, and a downtrend may take a pause backed by demand or buying interest. Support 1 refers to the nearby support level for the stock and if the price breaches the level, then Support 2 may act as the crucial support level for the stock.
Resistance: A level at which the stock prices tend to find resistance when they are rising, and an uptrend may take a pause due to profit booking or selling interest. Resistance 1 refers to the nearby resistance level for the stock and if the price surpasses the level, then Resistance 2 may act as the crucial resistance level for the stock.
Disclaimer
This article has been prepared by Kalkine Media, echoed on the website kalkinemedia.com/au and associated pages, based on the information obtained and collated from the subscription reports prepared by Kalkine Pty. Ltd. [ABN 34 154 808 312; AFSL no. 425376] on Kalkine.com.au (and associated pages). The principal purpose of the content is to provide factual information only for educational purposes. None of the content in this article, including any news, quotes, information, data, text, reports, ratings, opinions, images, photos, graphics, graphs, charts, animations, and video is or is intended to be, advisory in nature. The content does not contain or imply any recommendation or opinion intended to influence your financial decisions, including but not limited to, in respect of any particular security, transaction, or investment strategy, and must not be relied upon by you as such. The content is provided without any express or implied warranties of any kind. Kalkine Media, and its related bodies corporate, agents, and employees (Kalkine Group) cannot and do not warrant the accuracy, completeness, timeliness, merchantability, or fitness for a particular purpose of the content or the website, and to the extent permitted by law, Kalkine Group hereby disclaims any and all such express or implied warranties. Kalkine Group shall NOT be held liable for any investment or trading losses you may incur by using the information shared on our website.
