


Highlights
- HMC Capital delivered a 202.6% YoY surge in revenue and a 143.1% rise in post-tax operating earnings for 1HFY25.
- The company reaffirmed its FY25 dividend guidance of 12 cents per share and reported a pre-tax EPS tracking at 70 cents.
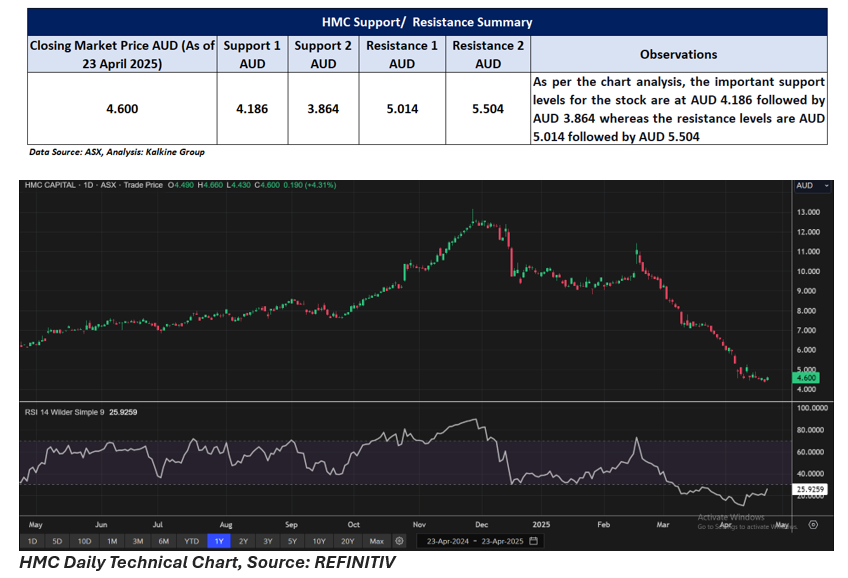
- HMC shares closed at AUD 4.600 on 23 April 2025, up 4.31% for the day but remain significantly below the 52-week high of AUD 13.160, reflecting a YTD decline of over 50%.
HMC Capital Limited (ASX:HMC) is an Australian diversified alternative asset manager focused on high-conviction and scalable real asset strategies. In the first half of fiscal year 2025 (1HFY25), the company posted total revenue of AUD 272.3 million, a 202.6% YoY increase compared to AUD 90.0 million in the same period the prior year. Operating earnings post-tax for the period surged 143.1% YoY to AUD 140.5 million, up from AUD 57.8 million.
This performance was underpinned by substantial growth in assets under management (AUM), which rose over 45% compared to June 2024, along with strategic deployment across HMC’s five core verticals: Digital Infrastructure, Energy Transition, Private Credit, Real Estate, and Private Equity. The company also reported strong investment returns and robust performance fees, particularly within its Private Equity division.
The period saw 240% YoY increase in pre-tax operating earnings and cash and cash equivalents of AUD 17.5 million.
Strategic Update and Investor Developments
On 17 April 2025, HMC announced that Cooper Investors ceased to be a substantial shareholder as of 16 April. Earlier this month, the company confirmed that its FY25 trading update showed annualised pre-tax EPS tracking at 70 cents, unaffected by a significant AUD 150 million distribution from its HMCCP Fund I. This distribution was largely driven by gains from Sigma Healthcare and Ingenia Communities.
Positive Outlook and Reaffirmed Guidance
Looking forward, HMC reaffirmed its FY25 dividend guidance of 12 cents per share, consistent with its strategy of reinvesting retained earnings into growth-oriented initiatives. The company expressed continued confidence in maintaining earnings momentum, supported by deployment activity and successful fundraising.
Platform growth is expected to remain strong, led by HMC’s five strategic pillars, with digital infrastructure, private credit, and private equity playing a central role in earnings growth and further AUM expansion.
Share performance of HMC
HMC closed at AUD 4.600 on 23 April 2025, up 4.31% on the day. Over the past week, the stock gained 1.5453%, but has seen significant declines over longer periods, with a 1-month drop of 36.3761%, a 3-month fall of 50.2702%, and a 6-month slide of 50.0542%. The company’s 52-week high was AUD 13.160 on 27-Nov-2024, while the 52-week low stands at AUD 4.340, touched on 22-Apr-2025.
Support and Resistance Summary
Note 1: Past performance is neither an Indicator nor a guarantee of future performance.
Note 2: The reference date for all price data, and currency, is 23 April 2025. The reference data in this report has been partly sourced from EODHD/Others.
Technical Indicators Defined:
Support: A level at which the stock prices tend to find support if they are falling, and a downtrend may take a pause backed by demand or buying interest. Support 1 refers to the nearby support level for the stock and if the price breaches the level, then Support 2 may act as the crucial support level for the stock.
Resistance: A level at which the stock prices tend to find resistance when they are rising, and an uptrend may take a pause due to profit booking or selling interest. Resistance 1 refers to the nearby resistance level for the stock and if the price surpasses the level, then Resistance 2 may act as the crucial resistance level for the stock.
Disclaimer
This article has been prepared by Kalkine Media, echoed on the website kalkinemedia.com/au and associated pages, based on the information obtained and collated from the subscription reports prepared by Kalkine Pty. Ltd. [ABN 34 154 808 312; AFSL no. 425376] on Kalkine.com.au (and associated pages). The principal purpose of the content is to provide factual information only for educational purposes. None of the content in this article, including any news, quotes, information, data, text, reports, ratings, opinions, images, photos, graphics, graphs, charts, animations, and video is or is intended to be, advisory in nature. The content does not contain or imply any recommendation or opinion intended to influence your financial decisions, including but not limited to, in respect of any particular security, transaction, or investment strategy, and must not be relied upon by you as such. The content is provided without any express or implied warranties of any kind. Kalkine Media, and its related bodies corporate, agents, and employees (Kalkine Group) cannot and do not warrant the accuracy, completeness, timeliness, merchantability, or fitness for a particular purpose of the content or the website, and to the extent permitted by law, Kalkine Group hereby disclaims any and all such express or implied warranties. Kalkine Group shall NOT be held liable for any investment or trading losses you may incur by using the information shared on our website.
