


Highlights
- Aroa Biosurgery reported its second consecutive quarter of positive operational cash flow, driven by record Myriad™ sales of USD 2 million in March and positive customer receipts.
- The company delivered a 23% YoY revenue growth in 1HFY25 to NZD 39.2 million, with gross profit up 27%.
- Aroa has reaffirmed its FY25 revenue guidance of NZD 81–84 million and targets a total addressable market of over USD 3.1 billion.
ASX-listed soft-tissue regeneration innovator Aroa Biosurgery Limited (ASX:ARX) has reported its second consecutive quarter of positive operational cash flow in the latest quarter ended 31 March 2025, driven by record Myriad™ monthly sales of USD 2 million and an increase in customer receipts.
The company ended the quarter with NZD 22 million in cash reserves and remains debt-free.
Half-Year Performance
For the half-year ended 30 September 2024 (1HFY25), Aroa Biosurgery delivered a 23% YoY increase in revenue, reaching NZD 39.2 million compared to NZD 31.9 million in the previous period. This growth was underpinned by a 45% surge in Myriad™ sales, along with increased market penetration in the United States and rising demand for OviTex™ through its partner, TELA Bio.
Gross profit also grew significantly, rising 27% YoY to NZD 34 million (1HFY24: NZD 26.8 million). The company’s loss before income tax narrowed to NZD 3.5 million, compared to NZD 4.1 million a year earlier, largely due to cost control efforts. While the company continued to invest in R&D and clinical trials, it posted a reduced normalised EBITDA loss of NZD 1.5 million for the period.
Recent Developments
Aroa continued to gain investor confidence, with State Street Australia Ltd and Australian Ethical Investment Ltd emerging as substantial holders with a 5.01% voting power as of 29 April 2025.
Positive Outlook
Aroa reaffirmed its full-year FY25 revenue guidance of NZD 81–84 million, representing 17–22% growth YoY, backed by an increase in product demand and improvement in sales performance across key markets.
The company also maintained its outlook for a normalised EBITDA profit of NZD 2–4 million, highlighting the impact of disciplined cost management and scale-driven efficiencies.
Aroa estimates a total addressable market (TAM) exceeding USD 3.1 billion, comprising USD 1.8 billion in opportunities from its proprietary product portfolio and USD 1.3 billion from its partnership with TELA Bio.
Share performance of ARX
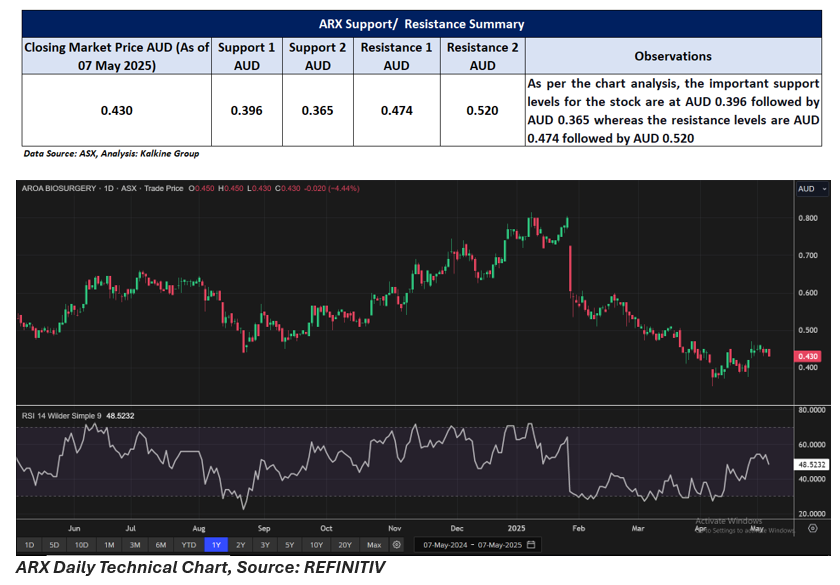
ARX shares closed 4.44% lower at AUD 0.43 per share on 7 May 2025. In a month, ARX’s share price has increased by almost 14.67% and in a year, share price has dropped by around 18.87%.
52-week high of ARX is AUD 0.815, recorded on 9 January 2025 and 52-week low is AUD 0.35, recorded on 7 April 2025.
Support and Resistance Summary
Note 1: Past performance is neither an Indicator nor a guarantee of future performance.
Note 2: The reference date for all price data, and currency, is 07 May 2025. The reference data in this report has been partly sourced from EODHD/Others.
Technical Indicators Defined:
Support: A level at which the stock prices tend to find support if they are falling, and a downtrend may take a pause backed by demand or buying interest. Support 1 refers to the nearby support level for the stock and if the price breaches the level, then Support 2 may act as the crucial support level for the stock.
Resistance: A level at which the stock prices tend to find resistance when they are rising, and an uptrend may take a pause due to profit booking or selling interest. Resistance 1 refers to the nearby resistance level for the stock and if the price surpasses the level, then Resistance 2 may act as the crucial resistance level for the stock.
Disclaimer
This article has been prepared by Kalkine Media, echoed on the website kalkinemedia.com/au and associated pages, based on the information obtained and collated from the subscription reports prepared by Kalkine Pty. Ltd. [ABN 34 154 808 312; AFSL no. 425376] on Kalkine.com.au (and associated pages). The principal purpose of the content is to provide factual information only for educational purposes. None of the content in this article, including any news, quotes, information, data, text, reports, ratings, opinions, images, photos, graphics, graphs, charts, animations, and video is or is intended to be, advisory in nature. The content does not contain or imply any recommendation or opinion intended to influence your financial decisions, including but not limited to, in respect of any particular security, transaction, or investment strategy, and must not be relied upon by you as such. The content is provided without any express or implied warranties of any kind. Kalkine Media, and its related bodies corporate, agents, and employees (Kalkine Group) cannot and do not warrant the accuracy, completeness, timeliness, merchantability, or fitness for a particular purpose of the content or the website, and to the extent permitted by law, Kalkine Group hereby disclaims any and all such express or implied warranties. Kalkine Group shall NOT be held liable for any investment or trading losses you may incur by using the information shared on our website.
