


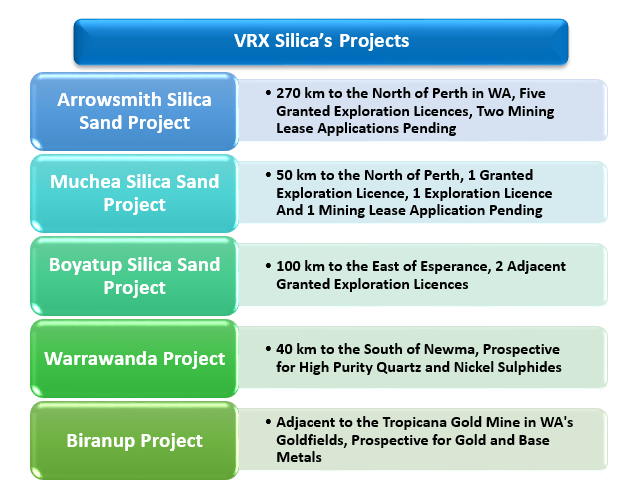
At the time when the world is running out of substantial availability of sand resource, VRX Silica Limited (ASX: VRX) is developing plans for the export and mining of high-quality silica sand to meet the global shortage of the product. The company has significant projects prospective for high-quality silica sand in Western Australia, with its key projects being Arrowsmith and Muchea Silica Sand Project.
Market Opportunities
The use of silica sand as a primary ingredient in industries like glass manufacturing and construction, offers significant business opportunities for the company. The sand has been declared as a strategic resource in the Asia-Pacific region due to its rising demand and dwindling supply. The demand for glass, required in energy-saving double glazing and automobile industry, is rising in the Asian regions. Besides, the high purity silica sand is also increasingly in demand for its use in the production of Silicon-Metal composite material and Photo Voltaic panels for high capacity Lithium-ion rechargeable batteries. It is anticipated that the demand for silica sand in the Asia-Pacific region will grow by 6.1 per cent in 2019 to 138 million metric tonnes.
VRX Silicaâs Key Projects
Among all the five projects, the company has made substantial progress at its Arrowsmith and Muchea Project, that can produce large quantities of silica sand. VRX Silica had also identified the following silica sand JORC Mineral Resource at both the projects:
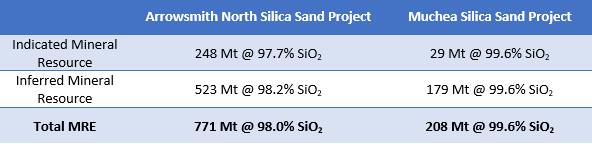
The above MRE results were provided by the company following the completion of the aircore drill program at the project areas. VRX Silica expects the majority of the Indicated Resource determined at Muchea Project to transform into the Probable Reserves in its approaching BFS. The company will also use the MRE for the Arrowsmith North Silica Sand Project to finalise estimates of Ore Reserves, which will further be used in the BFS.
VRX Silicaâs Financial Position
Recently, VRX Silica released its quarterly cashflow report for the quarter ending 30th June 2019. The company reported that it spent AUD 919k on the operating activities during the period, which included the exploration & evaluation payments worth AUD 576k. VRX Silica expects to further spend AUD 250k on exploration & evaluation payments during the next quarter. The cash balance of the company stood at AUD 1.5 million at the end of June quarter.
Stock Performance and Technical Analysis
VRX closed the trading session at AUD 0.115 on 13th August 2019. The stock has generated a tremendous return of 106.9 per cent in the last three months, following its major announcements.
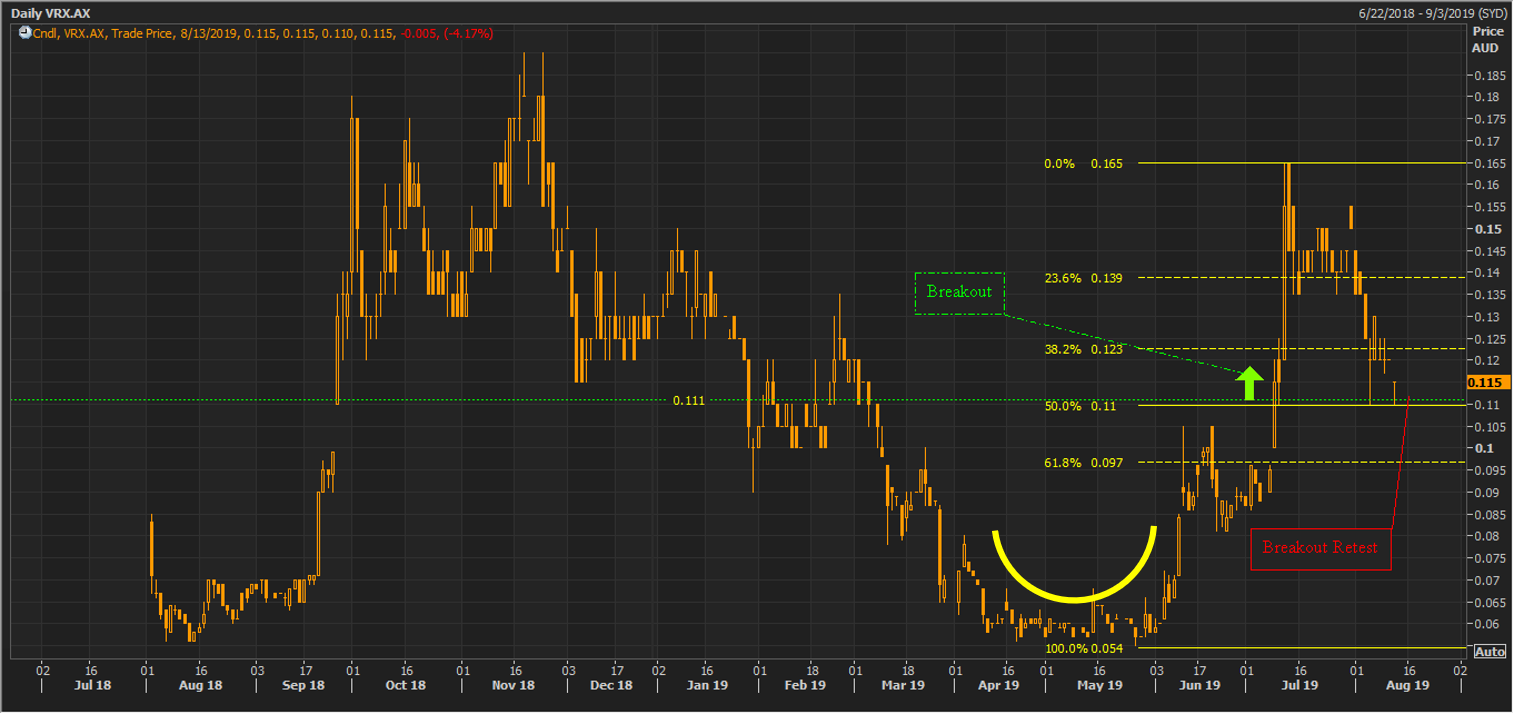
VRX Daily Chart (Source: Thomson Reuters)
On the daily chart, the share prices of the company rallied from the level of approx. A$0.054 registered during the month of May 2019, making a rounding bottom pattern (a bullish chart pattern- marked by a yellow semi-circle in the chart above) in the process. The prices broke out of the rounding pattern and crossed the initial hurdle of A$0.111. Post crossing the hurdle, the primary rally halted at approx. A$0.165, and the prices took a turnaround.
Upon applying Fibonacci retracement from the recent top, it can be noticed that the prices corrected 50.0 per cent of the initial rally and are currently retesting the breakout level of A$0.111. Investors should monitor the level of A$0.111, as it is the immediate support.
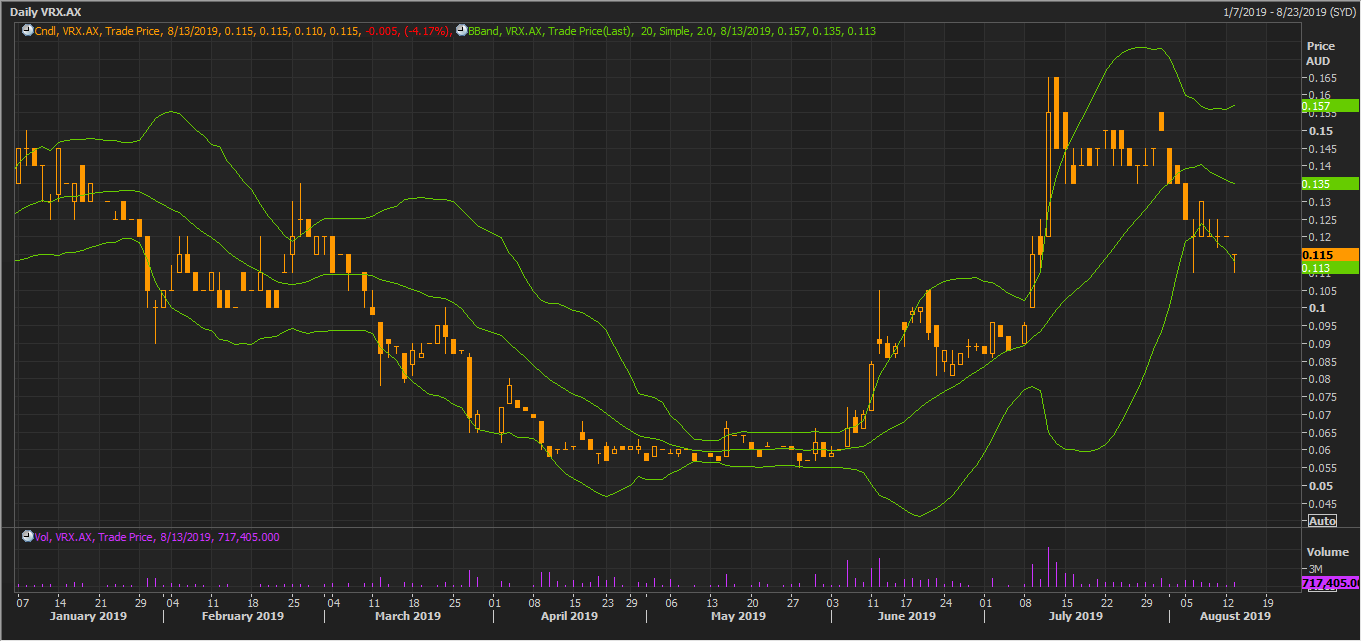
VRX Daily Chart (Source: Thomson Reuters)
On applying the 20 days smoothened Bollinger band on the daily chart, we can observe that the prices have now taken the support at the lower Bollinger band, which in turn, could provide short-term support to the share prices of the company. The academics propose that post migrating towards the upper or lower range of the Bollinger band, the prices generally move towards the median (which is currently at A$0.113).
The support from the lower band coupled with a slight increase in volume suggests potential buyerâs interest. The lower band should be monitored closely as it could provide short-term support to the share prices; however, a break below the band could stretch the Bollinger, which in turn, would suggest an increase in volatility.
In the status quo, the 20 days simple Bollinger has noticed a large gap between the upper and lower band as compared to the past price actions, which coupled with increased volume could represent the inclination towards the bull.

VRX Daily Chart (Source: Thomson Reuters)
On the chart shown above, the share prices of the company are showing a Golden Cross (bullish signal- marked by a circle) of 200 days Exponential moving average and 21 days simple moving average, which in turn, suggests a short-term bull strength in the making.
The share prices of the company are currently trading above the 200-days EMA, which is at A$0.093, which in turn, could act as the primary support if the shares of the company break below the support (previous breakout level) of A$0.111. The primary resistance for the shares is intact at the 21 days simple moving average, which is at A$0.135
Post observing the wave motion of the share prices, and after projecting the Fibonacci Series from the coordinates marked as 0,1,2 on the chart shown above, we can observe that the initial hurdle suggested by the 21 days simple moving average and 23.6 per cent of the Fibonacci projected merges.
Investors should monitor the level of A$0.135 as a break above it could establish a short-term uptrend in the share prices of the company.
Disclaimer
This website is a service of Kalkine Media Pty. Ltd. A.C.N. 629 651 672. The website has been prepared for informational purposes only and is not intended to be used as a complete source of information on any particular company. The above article is sponsored but NOT a solicitation or recommendation to buy, sell or hold the stock of the company (or companies) under discussion. We are neither licensed nor qualified to provide investment advice through this platform.
