


At the time when the world is facing a global sand crisis, VRX Silica Limited (ASX:VRX), formerly Ventnor Resources Limited, is focussing on meeting the global demand for the silica sand through its significant silica sand projects in Western Australia. The company is making progress with its strong project portfolio that includes five projects in Western Australia. Out of these five projects, three are prospective for silica sand, and the rest two are prospective for minerals like nickel sulphides, gold, high purity quartz and base metals.
VRX Silicaâs Silica Sand Strategy
The companyâs silica sand strategy involves three phases, as mentioned below:
- Identification and delineation of large-scale silica sand resources close to infrastructure.
- Exploration of opportunities for further processing to value-add.
- Development of plans for the mining and export of high-quality silica sand.
Financial Performance of VRX Silica
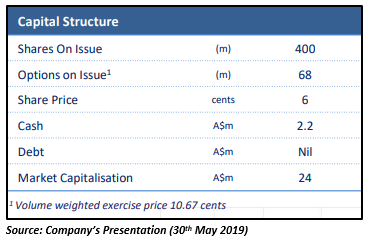
VRX Silica is ideally positioned to capitalise on strong market outlook and demand. It is an emerging strategic silica sand producer of Australia that has a rapid pathway to financing and production. The company enjoys debt-free status along with decent cash & cash equivalent reserve of $2.2 million as at May 2019. This can be considered as a positive sign for the company.
Let us have a look at the financial performance of the company in some detail:
Interim Results for the Half-Year Ending 31st December 2018
The company released its interim financial report for the half-year ending 31st December 2018 on 12th March 2019. It posted first half-year (1HFY19) performance wherein revenue from continuing operations stood at $35,900, while loss after tax amounted to about $2.26 million.
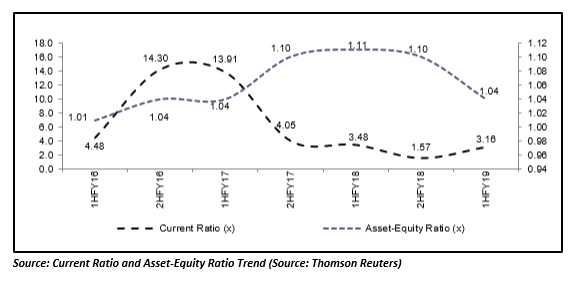
The Current Ratio stood at 3.16x in 1HFY19, which is higher than the industry median of 1.88x, displaying its decent liquidity position as compared to the broader industry and its ability to address the short-term obligations. Also, the decent liquidity levels further strengthen the confidence that VRX would be able to make prudent deployment towards its strategic business objectives. Assets/Equity ratio stood at 1.04x in 1H FY19, which is lower than the industry median of 1.68x and, thus, it looks like that the company is less dependent on debt when it comes to financing the assets.
The chart below demonstrates the trend of VRX Silicaâs Current Ratio and Assets/Equity ratio between 1HFY16 and 1HFY19:
The Basic and diluted loss per share in the half-year ending 31st December 2018 stood at 0.68 cents per share. The total assets of the company increased to $10.02 million during the period from $3.11 million in the half-year ending 30th June 2018, registering a rise of ~222 per cent.
VRX Silica reported ~$0.82 million net cash used in operating activities, against ~$0.41 million in the pcp. The net cash outflows from investing activities stood at ~$0.68 million against $0.51 million in the pcp. However, there was an increase in the net cash provided by financing activities to ~$2.37 million from ~$0.88 million in the pcp. VRX Silicaâs cash balance at the end of the half-year stood at ~$1.15 million.
VRX Silicaâs Performance on Annual Basis
The company published its annual report for the year ending 30th June 2018 in September last year. As per VRX Silica, the 2018 financial year was an exciting and eventful period for the company. The company identified a rising global demand for high-quality silica sand during the period.
The company mentioned that the global construction glass market would grow at a CAGR of 7 per cent between 2017 and 2023. As per Zion Market Research, the global construction glass market was valued at ~USD 93 billion in 2017 and anticipated to reach ~USD 138 billion by 2023.
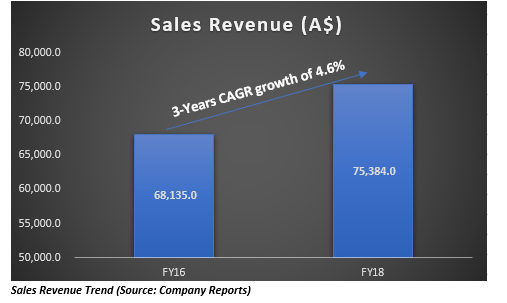
On a CAGR basis, the company posted top-line growth of 4.6 per cent over FY16-18, while loss after tax has been reduced over the same period. Basic and diluted earnings per share was recorded at -0.75 cents per share during FY18.
During FY18, the company reported the net operating cash outflow of ~$1.01 million against the value of ~$0.68 million in the pcp. Besides this, the company declared a net cash outflow of ~$0.91 million from investing activities during FY18 against a net cash inflow of ~$0.60 million in pcp. However, the net cash provided by financing activities was recorded at ~$0.97 million during the period.
Capital Raising
The company informed in April 2019 that it has received commitments for $2.26 million capital raising through a share placement to sophisticated and professional investors. The company received strong support for the Placement from a wide range of investors. According to VRXâs Managing Director, Bruce Maluish, the Placement places the company to continue to swiftly progress both the Muchea and Arrowsmith Silica Sand Projects.
VRX Silica announced that 37,666,666 new fully paid ordinary shares would be issued at an issue price of $0.06 per share under the Placement. The directors of the company had committed to subscribe for ~4.3 million shares, i.e. ~$260,000, subject to shareholder approval.
Recently, the company also issued a notification on the issue of 4,332,083 ordinary fully paid shares and 4,000,000 options. The fully paid ordinary shares were issued with regards to director participation in the placement, at an issue price of $0.06 per share, expiring on 3rd June 2020. The shares have been placed under voluntary escrow lock for a year. The options, issued under The Ventnor Employee Incentive Plan, are exercisable at 9c each, expiring on 30 November 2022.
VRX Silicaâs financial performance in the last few years indicate that the company is well positioned to progress with its silica sand development program. The company is also expected to complete the BFS (bankable feasibility studies) for three of its projects - Arrowsmith North Project, Muchea Project and Arrowsmith Central Project - in September 2019 Quarter.
Stock Performance
The companyâs stock settled the dayâs higher at AUD 0.096 (on 2nd July 2019), up by 10.35 per cent relative to the last closed price. The companyâs stock has generated an enormous return of 104.12 per cent during the last five years. Also, the stock has delivered a return of 47.46 per cent in the last month.
KNOW MORE ABOUT VRX SILICA HERE
Disclaimer This website is a service of Kalkine Media Pty. Ltd. A.C.N. 629 651 672. The website has been prepared for informational purposes only and is not intended to be used as a complete source of information on any particular company. The above article is sponsored but NOT a solicitation or recommendation to buy, sell or hold the stock of the company (or companies) under discussion. We are neither licensed nor qualified to provide investment advice through this platform.
