


Iron ore prices are under pressure in China over the increased inventory across the Chinese ports. The prices of iron ore on the Dalian Commodity Exchange slipped from its recent high of RMB 690.00 (Dayâs high on 16 September 2019) to the level of present low of RMB 624.50.
To Know More, Do Read: Iron Ore Double Top Unfolds; While Gold Consolidates in the International Market
Chinese Ports Inventory
The iron ore inventories across the 35 significant ports in China stood at 111.93 million today, which in turn, underpinned the growth in stocks of over 2.90 per cent against the previous week inventory of 108.75 million tonnes.
The iron ore prices in China, recently recovered from the level of RMB 571.00 (Dayâs low on 28 August 20190 to the level of RMB 690.00 as steel mills in China increased procurement ahead of the one-week national holiday in China, starting from 01 October 2019.
After a week of healthy gains, the iron ore prices again resumed the downward journey after the steel mills active purchase ended in China.
The daily iron ore deliveries from the 35 significant Chinese ports averaged 2.83 million metric tonnes for the week ended today, down by 67,000 metric tonnes from the previous week average, which reduced the ports stocks last week to 108.75 million metric tonnes.
Also Read: Iron Ore Rally Peaked-Out Over Global Economic Slowdown Concerns
What to Expect Ahead?
While the daily iron ore deliveries are going down, the market analysts predict the iron ore prices to remain stable till the national holidays kick in.
The highest steelmaking province of China-Tangshan is still witnessing a higher inflow of iron ore for the steel industry, which could provide the iron ore prices with some cushion over the coming week. As per the data, the daily iron ore deliveries from the Jingtang port-which serves the iron ore demand from the Tangshan province in China, inched up over 350,000 metric tonnes; while the daily port deliveries inched over 300,000 metric tonnes from the Caofeidian port during the current week.
Iron Ore on Charts
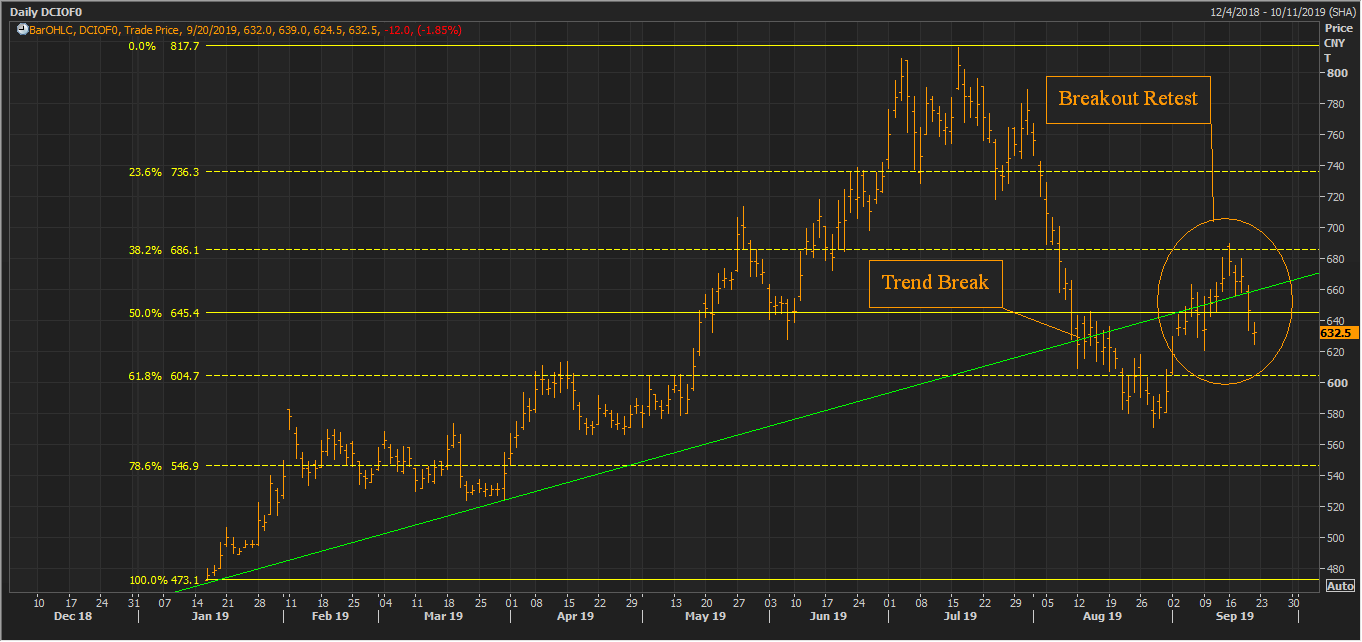
DCIOF0 Daily Chart (Source: Thomson Reuters)
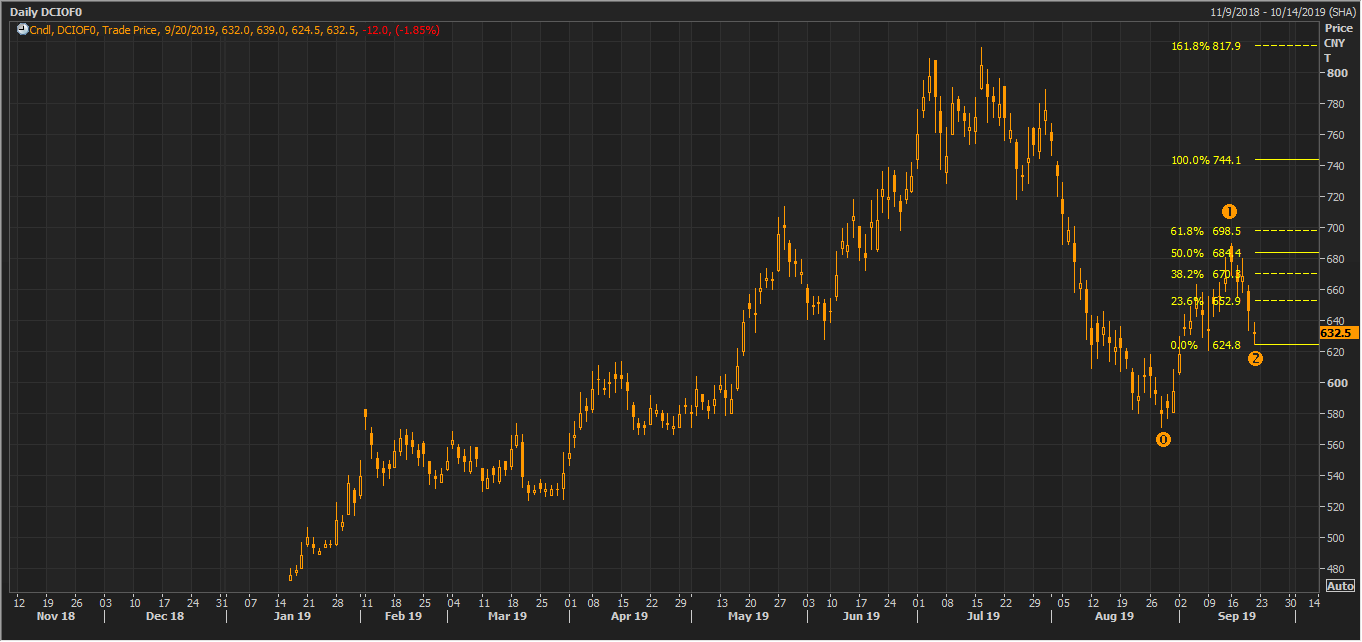
On the daily chart, the iron ore prices had given a trend breakout and post that the prices of the steelmaking raw material fell in the international as well in the domestic market of China. Recently, the prices have now corrected over 61.8 per cent of the initial rally, which started from the level of RMB 473.10 and halted at the level of RMB 817.7 in the January Future Contract.
In the status quo, the prices have rested the extended upward sloping trendline; however, the prices could not sustain above the trendline and fell again.
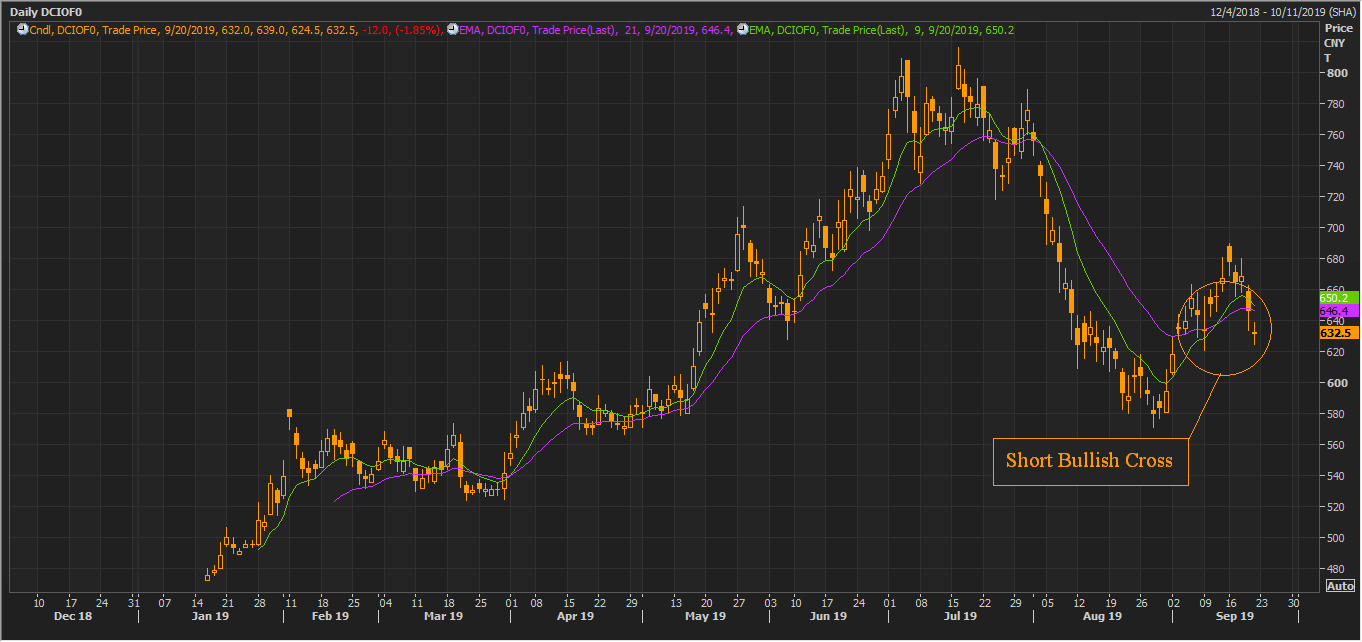
DCIOF0 Daily Chart (Source: Thomson Reuters)
Despite the inability to sustain above the trendline, the prices are showing a short-term positive crossover. The exponential moving average of 9 days in crossing the exponential moving average of 21 days from below, which is a sign of a short-term bullish sentiment for the iron ore prices.
Trend Analysis
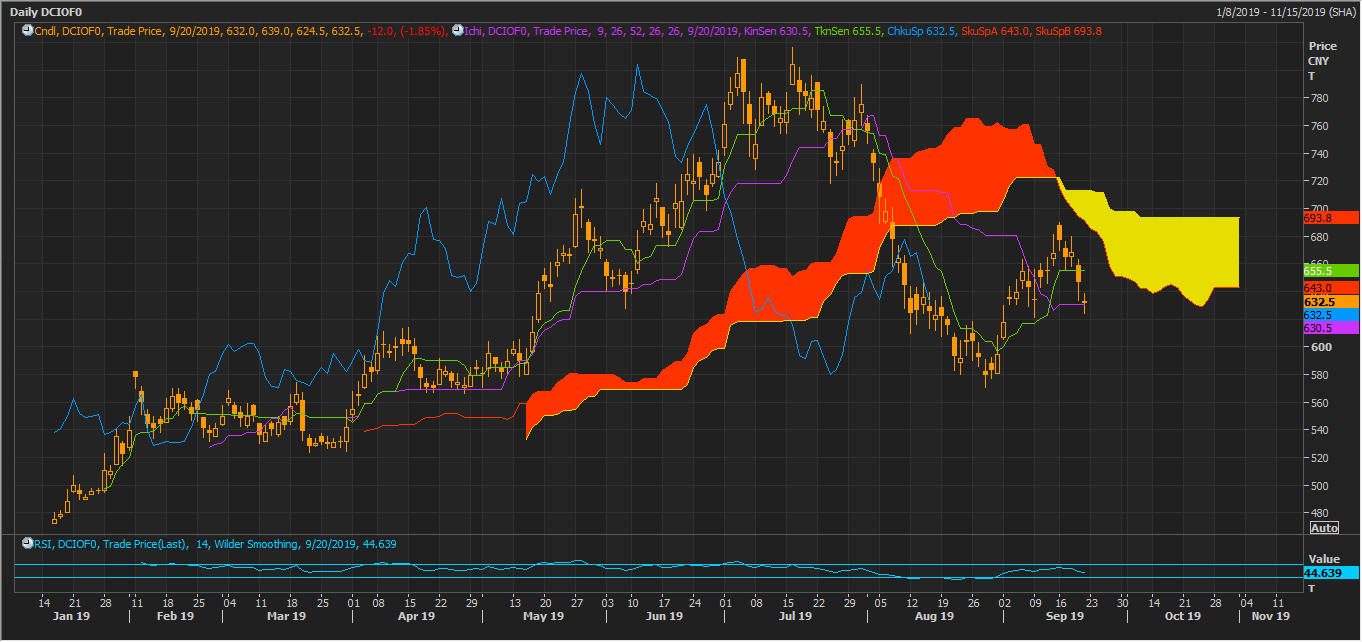
DCIOF0 Daily Chart (Source: Thomson Reuters) (Ichimoku Study)
On following the daily chart further and applying the Ichimoku, we can observe that the Span A is currently trading below the Span B. The Span A, which is the mean of the conversion line and the base line is at RMB 643.0, and the Span B, which is the mean of 52 days high and low is at RMB 693.8.
The spread between Span A and Span B is large and of almost 8 per cent, which in turn, suggests that the downtrend have strong strength.
The 14-day Relative Strength Index is at 44.639, which in turn, further supports the Ichimoku signals.
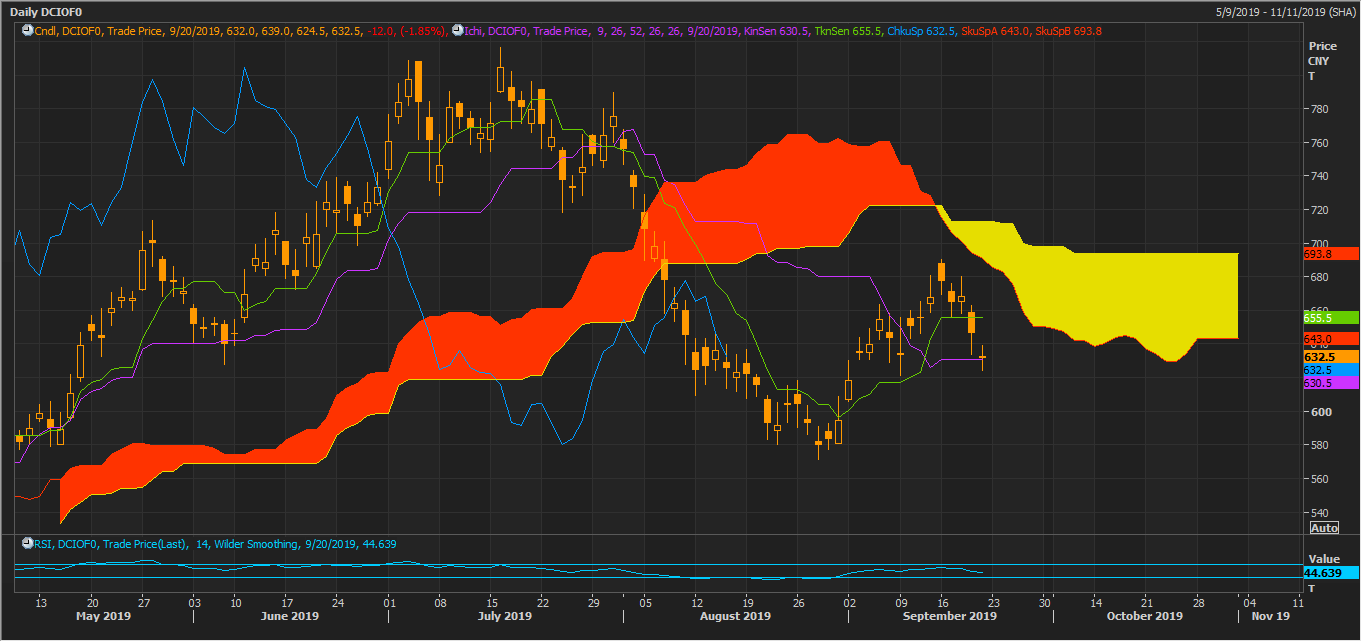
DCIOF0 Daily Chart (Source: Thomson Reuters) (Ichimoku Study)
The conversion line or the Tknsen (green), which represents the mean of 9 days high and low is crossing the base line or Kinsen (purple), which represents the mean of 26 days high and low, from below, which in turn, represents a positive crossover.
However, the crossover had taken place below the yellow cloud (which had formed, when Span A moved below Span B), which in turn, represents that the positive crossover does not have very good strength, yet, it is a positive signal.
DCIOF0 Daily Chart (Source: Thomson Reuters) (Ichimoku Study)
On applying the Fibonacci from the projected points marked as 0,1, and 2 on the chart shown above, we can notice that the prices are forming a wave, and these projected points would act as near-term price expectations and hurdles until the prices breach the low of the candle marked as 2.
Also Read: Australian Iron Ore Miners- RIO, FMG, And BHP Dashes; Bearish Cue On Charts Persist
Steel Market
The global steel market is currently flat amid tepid global economic conditions, and the steel prices lost significant value in the international market over the slowdown.
The steel rebar prices fell by over 7.60 per cent on a YTD basis (as on 19 September 2019), and the prices have lost over 15 per cent from its 2019 peak of US$488.50 a tonne on the London Metal Exchange.
However, the steel prices in China have shown slight recovery amid a fall in social and mill inventory, which in turn, could provide some cushion to the operating margins of the Chinese steelmakers, and could support the iron ore prices in the weeks ahead.
Over the long-run, the iron ore prices could witness a pressure of building inventory and restoring supply chain in Australia and Brazil. The Australian miners such as BHP Group (ASX: BHP), Rio Tinto (ASX: RIO), Fortescue Metals (ASX: FMG), have already kept their FY2020 guidance high, and the Brazilian giant- Vale is also moving out of the shackles.
To Know More, Do Read: Iron Ore Consolidates while Vale, Rio, BHP Ramp up Production; Whatâs Ahead for the Raw Material?
Disclaimer
This website is a service of Kalkine Media Pty. Ltd. A.C.N. 629 651 672. The website has been prepared for informational purposes only and is not intended to be used as a complete source of information on any particular company. Kalkine Media does not in any way endorse or recommend individuals, products or services that may be discussed on this site. Our publications are NOT a solicitation or recommendation to buy, sell or hold. We are neither licensed nor qualified to provide investment advice.
