


Australian iron ore miners listed on the domestic exchange such as Rio Tinto (ASX: RIO), BHP Billiton (ASX: BHP) and Fortescue Metals (ASX: FMG) are relishing over the iron ore price recovery in the international market. Iron ore prices have taken a turnaround after a sharp correction in the global market in the recent past.
The Price Movement
The price of iron ore on the Dalian Commodity Exchange (or DCE) in China rallied from the level of RMB 571.00 (Dayâs low on 28 August 2019) to the level of RMB 649.00 (Dayâs high on 4 September 2019), translating to a 13.66 per cent upside in few trading sessions.
Likewise, the prices zoomed up on the Chicago Mercantile Exchange from the level of US$80.16 (Dayâs low on 27 August 2019) to the level of US$91.57 (Dayâs high on 4 September 2019), marking an upside of 14.23 per cent in just few trading sessions.
Iron ore Demand & Supply Dynamics in China
Iron ore inventory across the 35 Chinese ports climbed to 110.65 million tonnes (as on 30 August) up by 1.44 million tonnes as compared to the previous corresponding period (or pcp). However, despite a rise in inventory, the current demand-pull in China fanned the prices.
The steel inventory in China further fell on 30 August 2019 to the level of 14.47 million tonnes, down by 1.14 per cent against pcp. Chinese steel mills were quick to stock the iron ore ahead of the coming 7-days golden week holidays in China in response to the fall in domestic inventory.
The demand push from the steel mills in China supported the iron ore price in the market, and the Australian iron ore miners saw their stock price bounce back on the back of iron ore price rally.
ASX-Listed Iron Ore Miners
Rio Tinto (ASX: RIO)
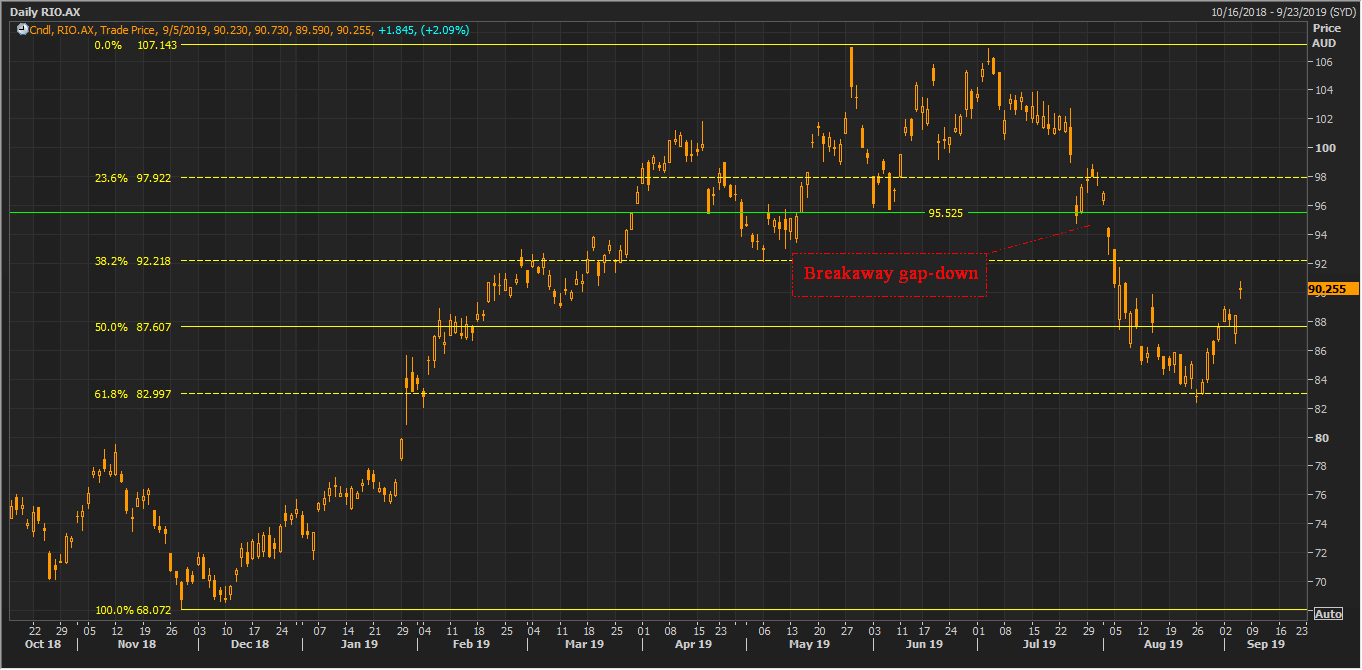
Rio rallied from the level of A$82.420 (Dayâs low on 26 August 2019) to the present high of A$90.535, which in turn, marked a 9.84 per cent upside. The stock is rallying from the previous week and is currently on an upside move.
Rio on Charts:
RIO Daily Chart (Source: Thomson Reuters)
On the daily chart, Rio corrected over 61.8 per cent of the primary upside rally, which started from the level of approx. A$68.072 to the level of approx. A$107.143. Recently, the stock witnessed a breakaway gap-down from the level of A$95.525 and fell further.
The level of A$95.525 would now act as a resistance to the share price of the company, and it should be monitored by the investors closely.
RIO Daily Chart (Source: Thomson Reuters)
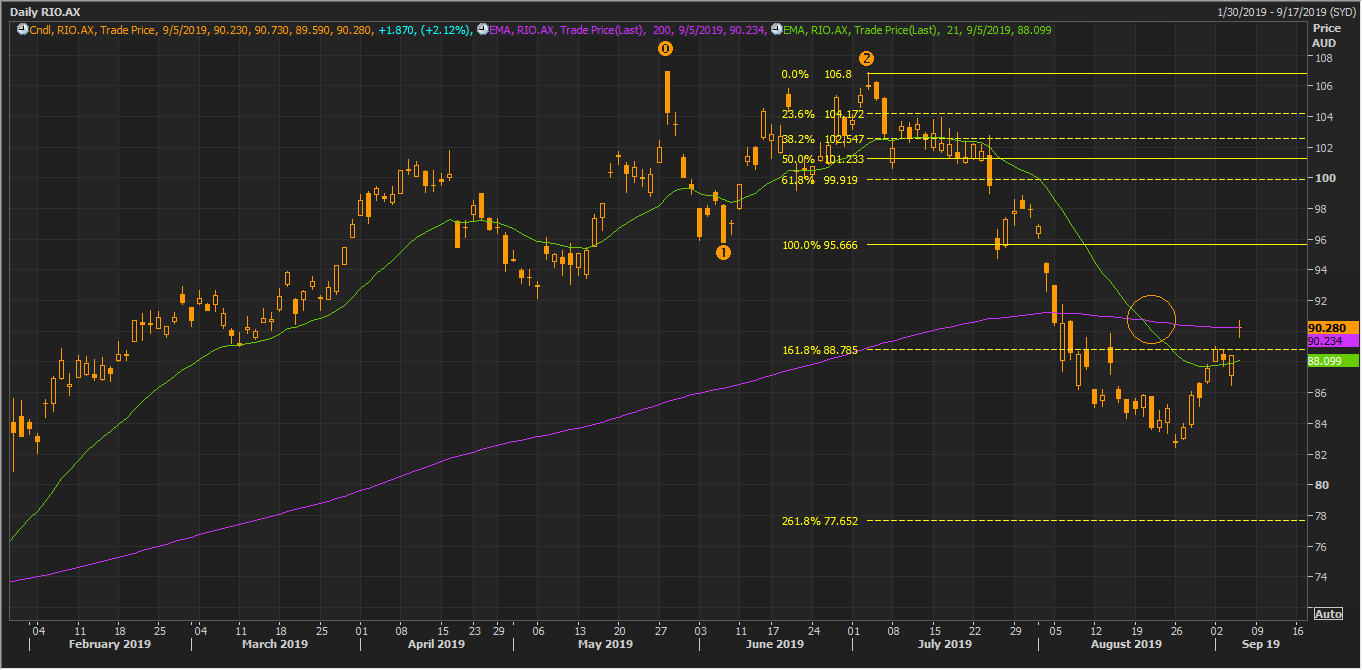
On further analysing the daily chart and post connecting the Fibonacci series from the projected points marked as 0,1,2 on the chart shown above, we can observe that the prices have completed the 161.8 per cent downside projection.
The 161.8 per cent projected level of the Fibonacci (A$88.785) is now immediate support for the stock and investors should watch the level closely as a break below the same could increase the strength of the bears.
On the technical indication counter, the price actions of Rio are showing a death crossover (bearish signal) of 21- and 200- days exponential moving averages.
The immediate support and resistance for Rio are at A$88.785 and A$95.525, respectively.
Fortescue Metals Group Limited (ASX: FMG)
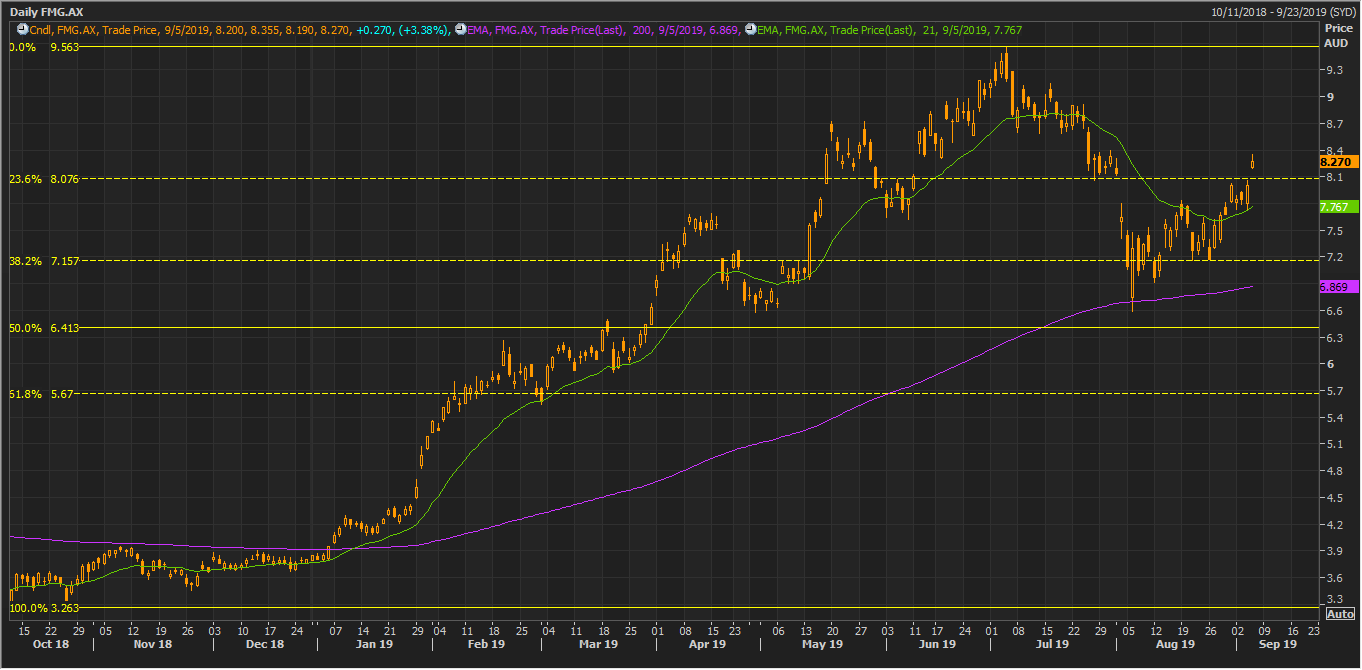
FMG rallied from the level of A$6.590 (Dayâs low on 06 September 2019) to the current high of A$8.340, an upside of over 26 per cent. The stock is under a bull run from past five weeks.
FMG on Charts:

FMG Daily Chart (Source: Thomson Reuters)
On the daily chart, FMG is forming a potential bearish flag pattern, which is pending the confirmation. The prices are now moving toward the upper line of the bearish flag, and if FMG takes the hurdle from the upper boundary of the flag and falls back below the lower boundary of the flag, it would confirm the formation of the bearish flag.
FMG Daily Chart (Source: Thomson Reuters)
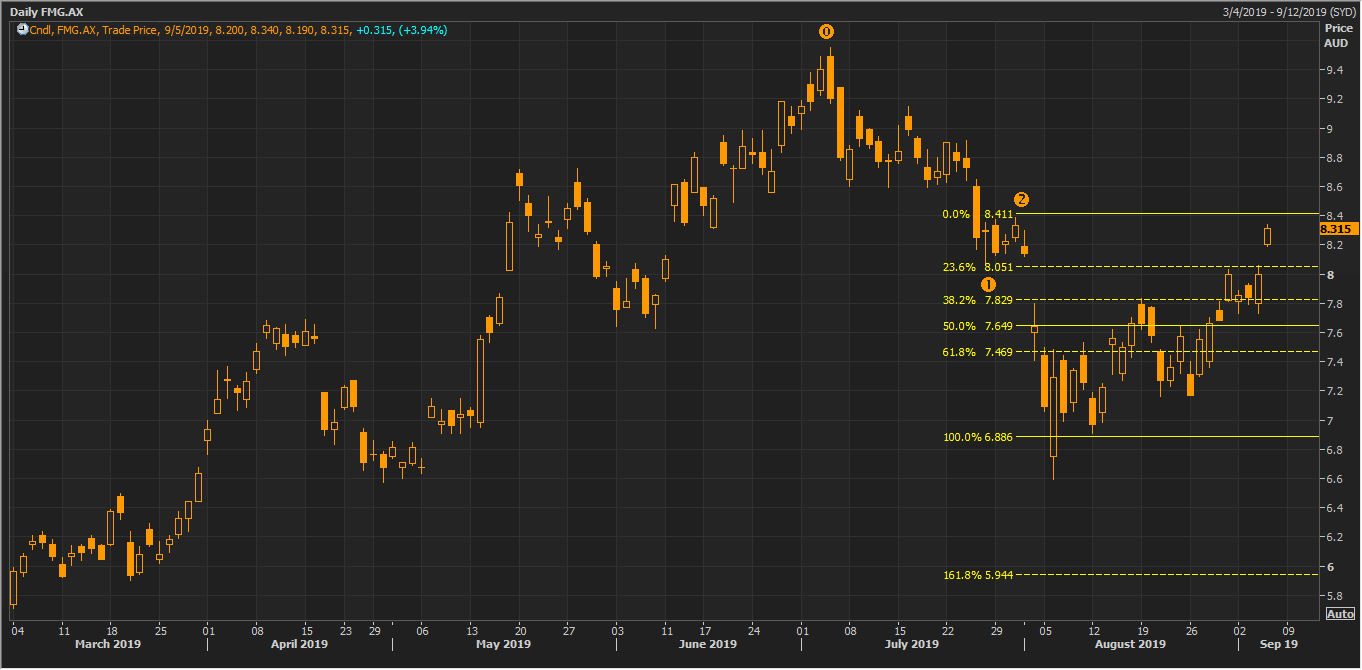
FMG corrected almost 50 per cent of the initial upside rally which started from the level of A$3.322 and halted at the level of A$9.563. As of now, the stock is trading below the 21-day exponential moving average, which is at A$7.771.
The 21-day EMA could act as the primary hurdle for the share price of the company. The 200-day EMA is at A$6.869 and could act as the support for the share price.
FMG Daily Chart (Source: Thomson Reuters)
On projecting the downside Fibonacci from the coordinates marked as 0,1,2, we can observe that the major hurdle for FMG is intact at A$8.411. The above-shown Fibonacci levels would remain valid until the stock price crosses the high of the candle marked as 2.
BHP Group Limited (ASX: BHP)
BHP rallied from the level of A$34.420 (Dayâs low on 26 August 2019) to the level of A$36.700 (Dayâs high on 03 August 2019).
BHP on Charts:
BHP Daily Chart (Source: Thomson Reuters)
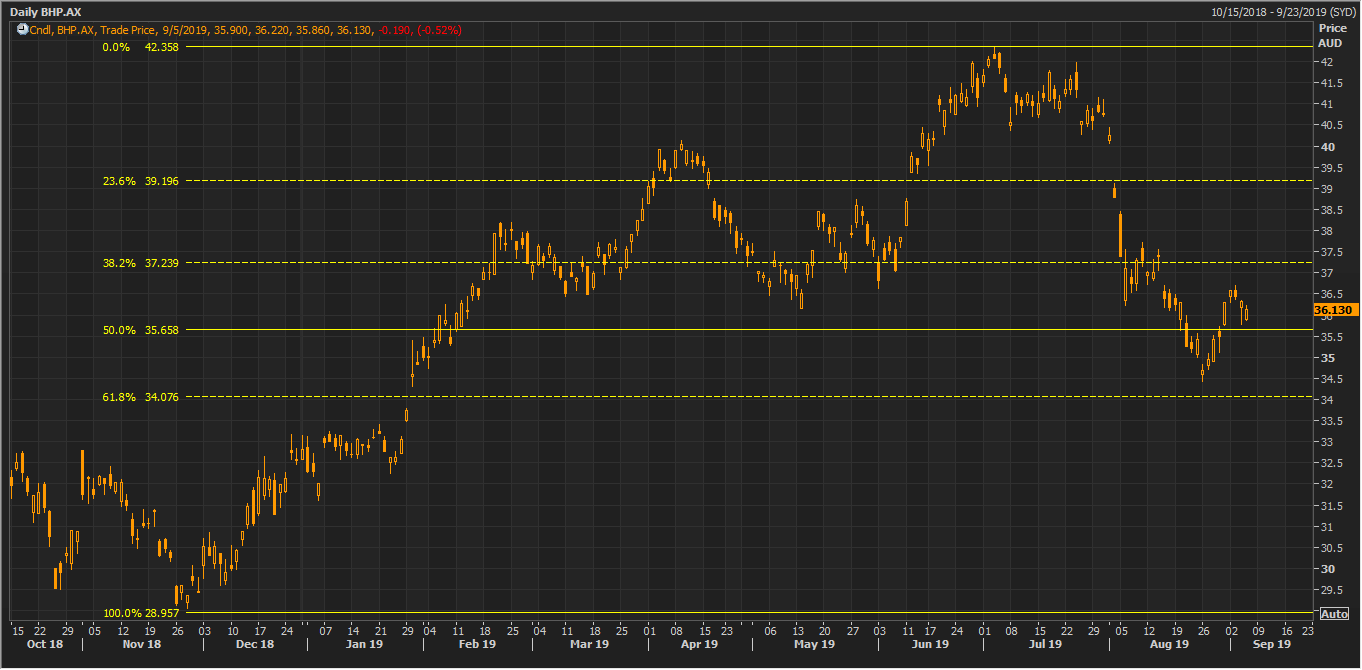
BHP has corrected almost 61.8 per cent of the primary rally which started from the level of A$28.957 to the level of A$42.358.

BHP Daily Chart (Source: Thomson Reuters)
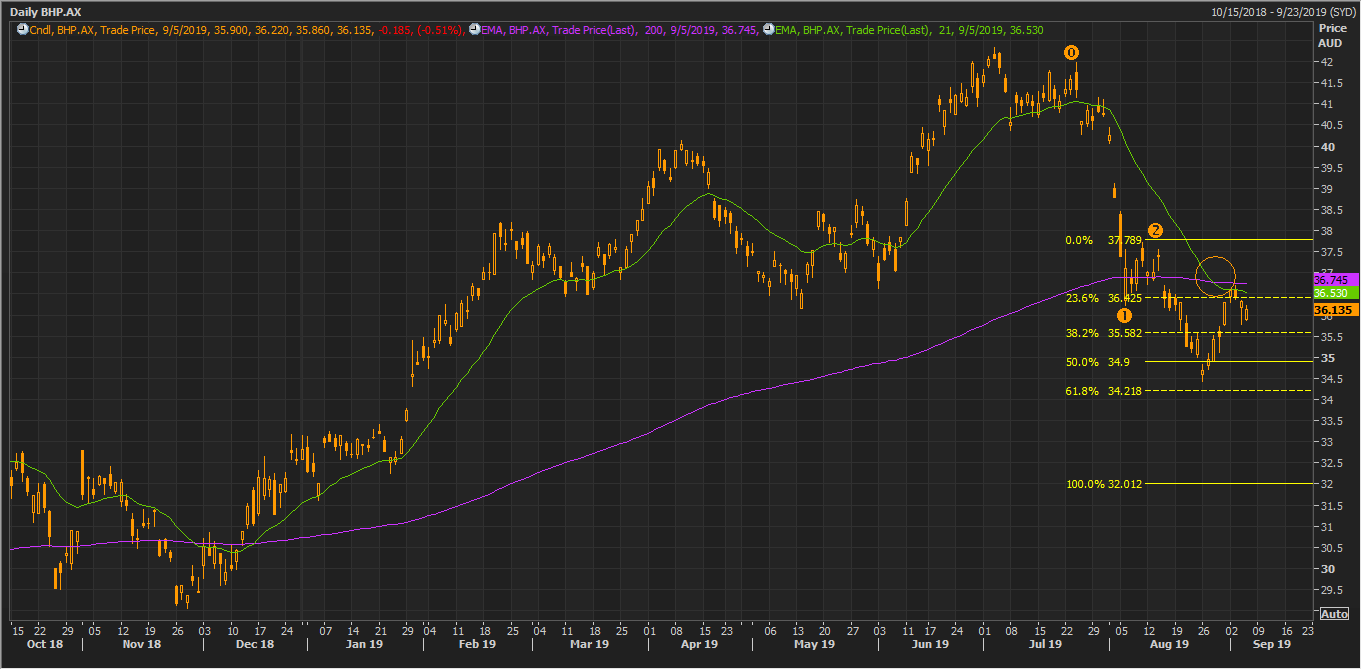
Recently, the prices witnessed a breakaway gap-down, and at present, BHP is showing a potential bearish flag on the daily chart, which is awaiting confirmation.
The stock is currently moving towards the upper boundary of the bearish flag, and if BHP faces the resistance from the upper boundary and falls back below the lower boundary of the flag, it would confirm the formation of the bearish flag on the daily chart.
BHP Daily Chart (Source: Thomson Reuters)
On projecting the Fibonacci series from the points 0,1,2, we can observe that BHP took a U-turn from the 61.8 per cent projected level and the Fibonacci levels would hold until BHP crosses the high of the candle marked as two on the chart shown above.
The stock is currently trading below its 21- and 200-days EMAs, which are at A$36.530 and A$36.745, respectively, and showing a bearish cross over.
In a nutshell, the ASX-listed iron ore miners relished over appreciation in iron ore prices; however, the charts are yet to confirm any major breakout or bullish signals to decide on the upcoming trend. Hence, investors should remain cautious and should wait for solid confirmation before initiating any move of buy or sell on the above discussed ASX-listed iron ore stocks.
Also Read: BHPâs Pessimism Drags Iron Ore Down; While 62 per cent Fe Struggles to Rebound
Disclaimer
This website is a service of Kalkine Media Pty. Ltd. A.C.N. 629 651 672. The website has been prepared for informational purposes only and is not intended to be used as a complete source of information on any particular company. Kalkine Media does not in any way endorse or recommend individuals, products or services that may be discussed on this site. Our publications are NOT a solicitation or recommendation to buy, sell or hold. We are neither licensed nor qualified to provide investment advice.
