


Australiaâs Technology Sector: The technology sector of Australia has been expanding rapidly with over 20k new app developers entering the market recently. The apps have now become a substantial resource for the digital economy and are being utilised by a million of users around the world. Businesses in the industry are improving their productivity by adding up new technologies like artificial intelligence, robotics and autonomous systems in their operations. This has in turn provided a boost in the job market, bringing in well-paying jobs for people of all qualifications.
NextDC Limited
NextDC Limited (ASX: NXT) develops and operates independent data centres in Australia.
Shareholding: The company recently updated that the voting power of Greencape Capital Pty Ltd increased from 5.39% to 6.41%. In addition, Vanguard Group became a substantial shareholder with 5.015% of the voting power.
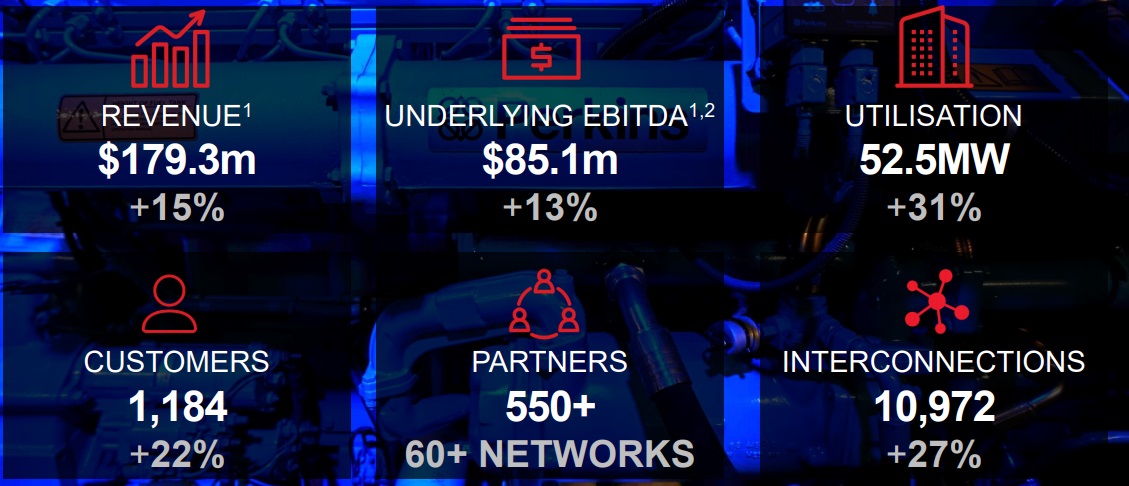
FY19 Performance: During the year ended 30 June 2019, revenue amounted to $179.3 million, up 15% on the prior corresponding period revenue of $156.3 million. Underlying EBITDA for the year stood at $85.1 million, up 13% on the prior corresponding period EBITDA of $75.6 million. Statutory net loss after tax was reported at $9.8 million, as compared to profit of $6.6 million in the prior corresponding period. Underlying capital expenditure for the year amounted to $378 million, as compared to the FY18 capital expenditure of $285 million. During the year, the company generated an operating cash flow amounting to $39.4 million, as compared to $33.4 million in prior corresponding period. Cash and cash equivalents as at 30 June 2019 stood at $399 million.
Key Performance Highlights (Source: Company Presentation)
In FY19, the company secured a senior unsecured debt of $500 million. It also refinanced its syndicated senior secured debt facility of $300 million. The company also completed the acquisition of land and building, leading to rental savings of around $15 million per annum.
Business Performance: As at 30 June 2019, contracted utilisation went up to 52.5MW, representing an increase of 31% on pcp. The number of customers went up to 1,184 as at 30 June 2019, up 22% on 972 customers in prior corresponding period.
FY20 Guidance: Revenue in FY20 is expected to be in the range of $200 million - $206 million. Underlying EBITDA in FY20 is expected to be between $100 million and $105 million. FY20 capital expenditure is forecasted to be in the range of $280 million - $300 million.
Stock Performance: The stock of the company generated negative returns of 8.01% and 9.41% over a period of 1 month and 3 months, respectively. After the close of trading on ASX, the stock quoted $6.280, up 2.78% on 06 September 2019.
Appen Limited
Appen Limited (ASX: APX) provides data solutions and services for machine learning and AI related applications for global tech players, auto manufacturers and government organizations.
Recent Update: The company issued 7,033 new fully paid ordinary shares from its capital as a result of vesting of performance rights.
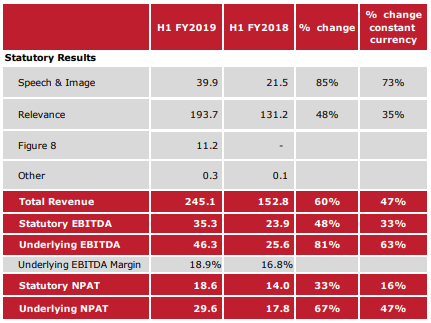
1H19 Financial Performance: During the first half ended 30 June 2019, the company reported revenue amounting to $245.1 million, up 60% on prior corresponding period. Underlying EBITDA for the period stood at $46.3 million, up 81% on prior corresponding period. Statutory EBITDA for the period went up by 48%. Underlying NPAT for the period amounted to $29.6 million, up 67% on prior corresponding period. Statutory NPAT stood at $18.6 million, up 33% on pcp. During the half, the company reported relevance revenue amounting to $193.7 million, up 48% on pcp. Underlying EBITDA margin also improved during the period, from 16.8% on prior corresponding period to 18.9% in the current period. The Board declared an interim dividend of 4.0 cents per share, in line with the prior corresponding period.
FY19 Financial Summary (Source: Company Presentation)
Business Performance: In the first half, the company reported strong performance for its core business. Speech and image data grew at a rate of 85%, relevance revenue increased by 48% along with expansion of EBITDA margins. The acquisition of Figure Eight in April 2019, is accelerating the companyâs technology roadmap, expanding markets and diversifying its revenue. Relevance data was characterised by high revenue growth and increased margins as a result of system and process upgrades.
Stock Performance: The stock of the company generated negative returns of 5.21% and 0.47% over a period of 1 month and 3 months, respectively. After the close of trading on ASX, the stock quoted A$26.120, up 2.55% on 06 September 2019 and had a market capitalisation of $3.08 billion.
Nearmap Limited
Nearmap Limited (ASX: NEA) is engaged in online aerial photomapping through its subsidiaries.
Directorâs Interest: In a recent announcement, it was updated that Peter James, director of the company, acquired 1,500,000 fully paid ordinary shares, disposing off 1,500,000 director options exercisable at $0.551 each. In addition, he also disposed 400,000 ordinary shares for a consideration of $2.68 per share.
Appointment of Director: The company recently notified regarding the appointment of Tracey Horton as an independent non-executive director on the Board.
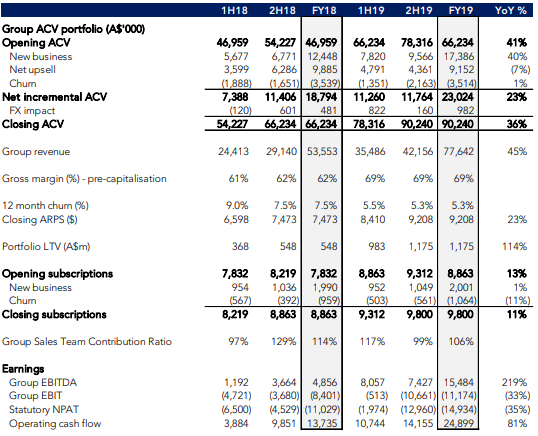
FY19 Results: During the year, group annualised contract value stood at $90.2 million, increasing 36% on the prior corresponding period. Statutory revenue was reported at $77.6 million, up 45% on pcp revenue of $53.6 million. Global subscriptions for the year increased to 9,800, up 11% on the prior corresponding period. Group average revenue per subscription was $9,208, as compared to $7,473 in the prior corresponding period. Group EBITDA was reported at $15.5 million, as compared to $4.9 million in the prior corresponding period. Portfolio Lifetime Value during the year increased to $1.2 billion, as compared to $0.5 billion in pcp, reflecting growth in portfolio, pre-capitalisation gross margin expansion and reducing churn.
FY19 Performance (Source: Company Presentation)
Performance - North America: In North America, the company reported record annual ACV growth. ACV portfolio as at 30 June 2019 was valued at US$22.7 million, growing 76% in comparison to US$12.9 million as at 30 June 2018. Subscriptions during FY19 were reported at 1,425, up 51% in comparison to 946 subscriptions in prior corresponding year. ARPS increased by 17% to US$15,918, as compared to US$13,603 in FY18. Pre-capitalisation gross margin was reported at 20%, against 55% in pcp.
Performance â ANZ: ACV portfolio for Australia and New Zealand amounted to $57.9 million, as at 30 June 2019, representing 19% growth on portfolio value as at 30 June 2018. Subscriptions in the region were reported at 8,375, as compared to 7,917 in prior corresponding period. Pre-capitalisation gross margin for the period was consistent with pcp at 91%.
Cash Flow Update: During the year, the group achieved cash flow break even guidance for its core business. Group cash balance as at 30 June 2019 was reported at $75.9 million, as compared to $17.5 million as at 30 June 2018. The period was marked by strong net operating cash inflows of $24.8 million, as compared to $13.7 million in prior corresponding period.
Stock Performance: The stock of the company generated negative returns of 13.95% over a period of 1 month. After the close of trade hours on ASX on 06 September 2019, the stock quoted a market price of $2.750, up 2.99% relative to its last trade.
Bravura Solutions Limited
Bravura Solutions Limited (ASX: BVS) a developer, licensor and caters to the maintenance of admin and management software applications.
Shareholding: As per a recent announcement to the exchange, the company reported that Vinva Investment Management ceased to be a substantial shareholder.
Appointment of Chairman: The company also updated that Neil Broekhuizen was appointed as the new Chairman on the Board with effect from 23 August 2019. Brian Mitchell, the former Chairman retired on the same date.
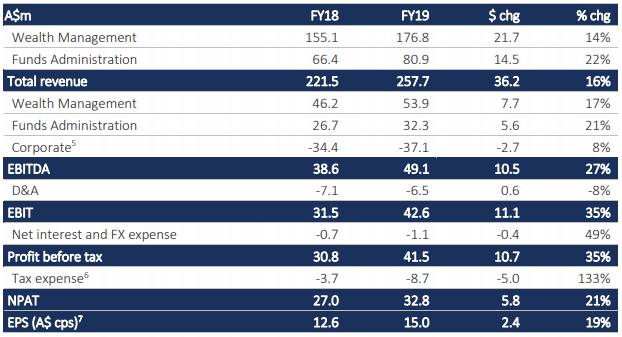
FY19 Financial Highlights: During the year ended 30 June 2019, the company generated revenue amounting to A$257.7 million, up 16% on the prior corresponding period revenue of A$221.5 million. EBITDA for the year was reported at A$49.1 million, increasing 27% in comparison to prior corresponding EBITDA of A$38.6 million. Net profit after tax amounted to A$32.8 million, up 21% in comparison to A$27.0 million in prior corresponding year. EBITDA margin increased from 17.4% in FY18 to 19.0% in FY19. FY19 earnings per share amounted to 15.0 cents, rising 19% on pcp.
Segment Results: Wealth Management segment reported revenue of A$176.8 million, up 14% on pcp. EBITDA for the segment increased by 17% to A$53.9 million. Revenue from fund administration was reported at A$80.9 million, up 22% in comparison to pcp. EBITDA amounted to A$32.3 million, up 21% on pcp.
Summary of Financial Performance (Source: Company Reports)
Guidance: Net profit after tax growth in F20 is expected to be in the mid-teens, on the back of strong recurring revenue and new sales opportunities.
Stock Performance: The stock of the company generated returns of 3.50% and -2.87% over a period of 1 month and 3 months, respectively. After the close of trade hours on ASX on 06 September 2019, the stock quoted a market price of $4.850, up 2.53%, relative to its last trade.
Disclaimer
This website is a service of Kalkine Media Pty. Ltd. A.C.N. 629 651 672. The website has been prepared for informational purposes only and is not intended to be used as a complete source of information on any particular company. Kalkine Media does not in any way endorse or recommend individuals, products or services that may be discussed on this site. Our publications are NOT a solicitation or recommendation to buy, sell or hold. We are neither licensed nor qualified to provide investment advice.
