


Gold is the commodity of 2019, thanks to the escalated geopolitical issues and falling bond yields, gold spot climbed from $1,655.14 (low on December 2018) to the peak of $2,322.26 (high in August 2019), which underpinned a price appreciation of over 40 per cent.
The impeccable performance delivered by gold in the market had dragged many ASX gold stocks along with it, and gold stocks bagged the number one spot at the top-performing list during the third quarter of the year 2019.
To Know More, Do Read: A Glimpse Over ASX-Listed Top Performing Mining Stocks
However, the recent consolidation in the gold prices coupled with the ease in geopolitical tensions, with China and the United States removing considerable tariffs on each other to ink a trade deal, has clouded the gold shine in the market, and bullion investors are now aligning the ASX gold stocks with the gold prices in the market.
To Know More, Do Read: ASX Gold Stocks- A Healthy Buy for Profits?
The deep correction in the gold prices is making the gold stocks attractive; however, many investors are concerned over the future of gold, which acts as a booster for ASX gold stocks.
Is Future for Gold Shiny or Does it Lack Lustre?
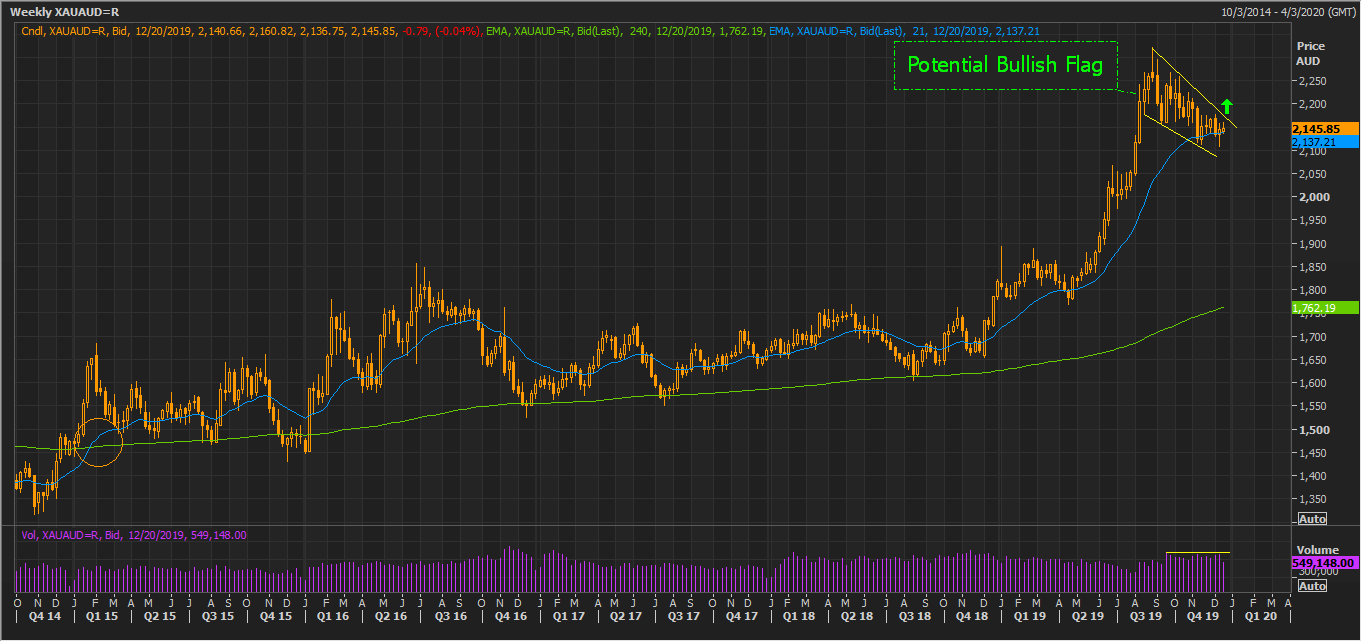
XAUAUD Weekly Chart (Source: Thomson Reuters)
On the weekly chart, gold is forming what is known to be a bullish flag (potential), which is a bullish pattern; however, the pattern is yet to give confirmation. For now, the prices are trading around the resistance line of the pattern, and a break above the same with decent volume would confirm the same.
The prices are trading above the long-term exponential moving average of 240 days, which is currently at $1,762, and the short-term exponential moving average of 21-day, which is at $2,137. The 21-day exponential moving average crossed the 240-day exponential moving average from below to establish a positive cross.
It could be seen on the chart above, that the weekly candle penetrated the 21-day exponential moving average, which reflects that considerable volatility exists in gold, and investors should keep a margin of 1 to 2 per cent before confirming the potential bullish flag.
Furthermore, the weekly chart is showing decent recovery in gold prices post a sell-out, with steady volume, which further reflects that bulls still hold interest in gold.
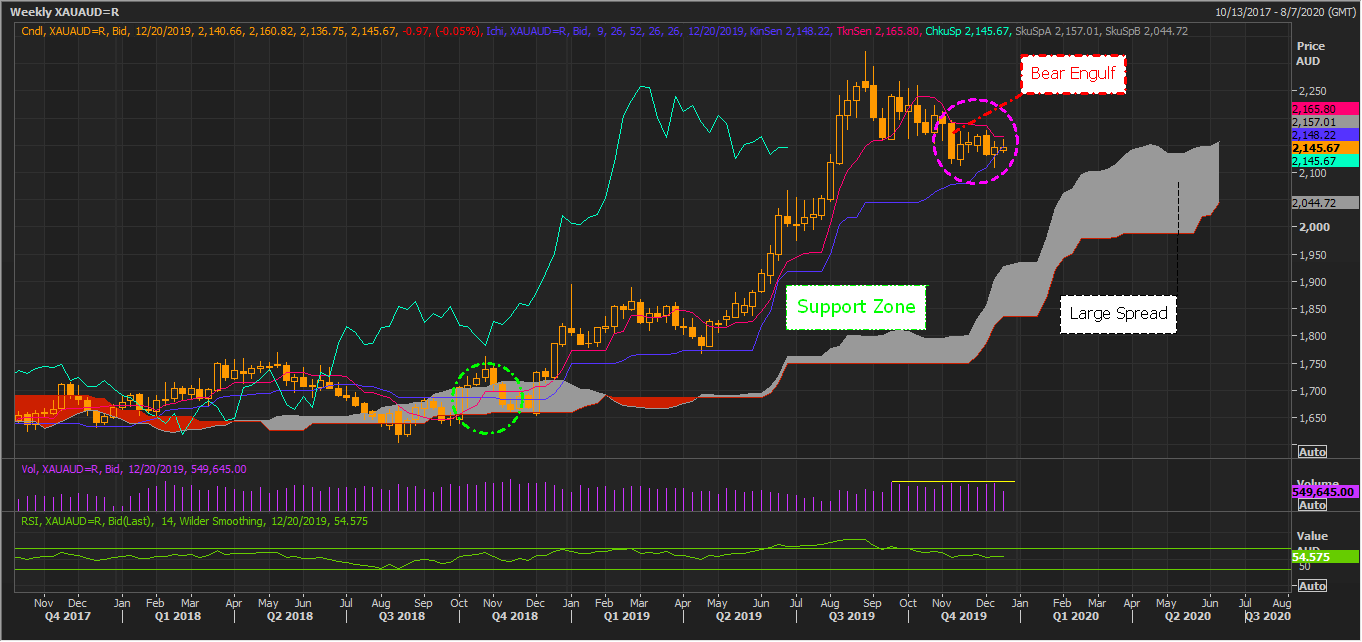
XAUAUD Weekly Chart (Ichimoku Clouding) (Source: Thomson Reuters)
Post applying the Ichimoku clouding technique on the weekly chart, it could be seen that the stock is currently moving in an uptrend with a positive crossover between the conversion line (pink line) (mean of 9-week high and low) and the base line (navy blue) (mean of 26-week high and low), established once the conversion line crossed the base line from below.
The gold spot is currently trading above Span A, which is the mean of the conversion line and the base line with a large spread between Span A and Span B, which is the mean of 52-week high and low. The increase in the spread between Span A and Span B reflects that bulls could possibly dominate the market.
The grey cloud, which formed once Span A crossed the Span B, is the support zone for gold. One thing which is particularly interesting, i.e., post the formation of a bearish engulfing candle, bulls quickly took charge, and prices increased with good volume, which further reflects that the bullsâ interest is still prevailing in the market.
The 14-week Relative Strength Index is complementing the recovery in gold prices and is presently trading above its mean value of 50.0 at 54.57, which suggests that gold is relatively in the oversold zone, which makes long-term prospect on the gold shiner.
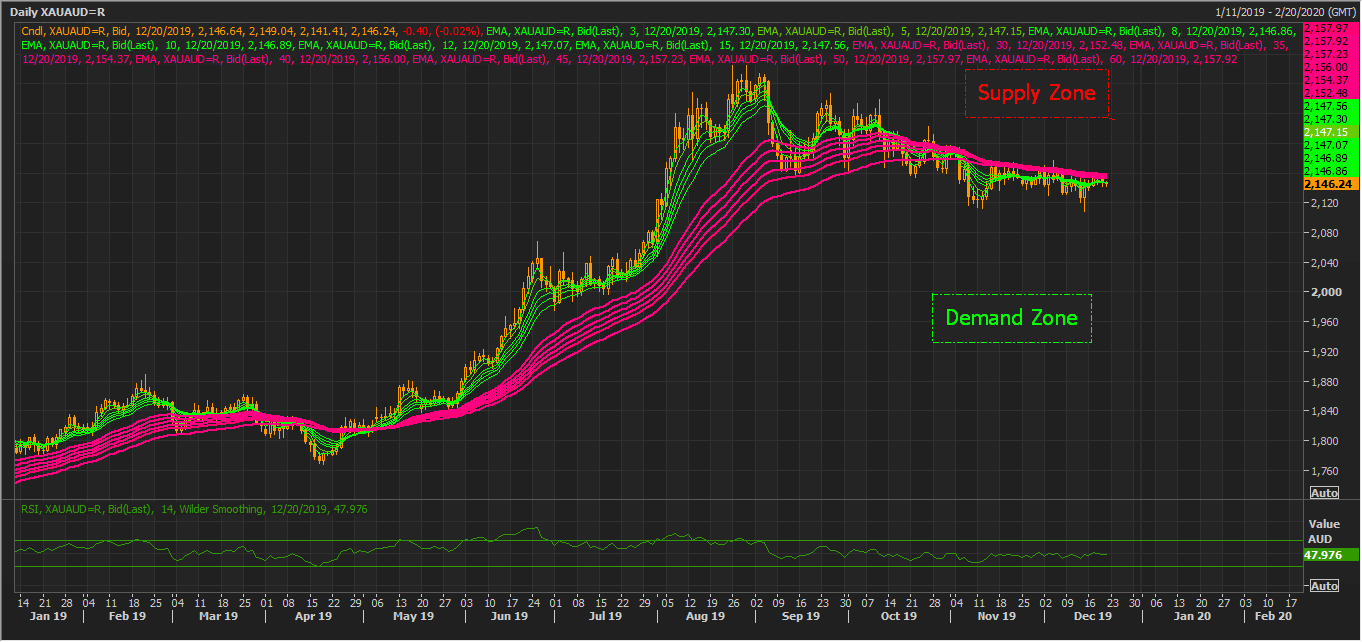
XAUAUD Daily Chart (Source: Thomson Reuters)
On narrowing down the weekly chart to the daily timeframe, it could be seen that gold prices are facing oversupply issues, not in terms of the market, but in terms of charts. The prices are currently below the pair of short-term moving averages (guppy moving averages), which establishes the fact that bears are currently countering the efforts from bulls to take the prices up, by supplying the contracts (i.e., by taking the sell side).
Such counters from bears reflect that gold prices are currently in a tug-of-war with bears taking the reverse side in equal proportion as bulls, which could be inferred from the small gap between the pairs of short-term moving averages and long-term moving averages (guppy moving averages).
To future judge the momentum in gold prices, investors can replicate the study and observe for the spread between short-term moving averages and long-term moving averages. If the short-term moving averages slip below the long-term moving averages with a large gap, that will reflect the strength of bears, otherwise, if the spread increase in the reverse direction it would reflect that bulls are gaining the upper hand.
Gold Continues the Contango
Comex gold futures and the futures curve of gold both are moving in contango, which further suggests that the market participants are relatively bullish on gold. While the gold prices are maintaining contango in the futures contract, the current futures contract are relatively trading in the negative zone as compared to the far expires contract.
Many industry experts anticipate the second quarter of the year 2020 to be challenging for the global market and for few commodities including iron ore; while such anticipations are already in place, it is well known that gold exhibit negative correlation with many other commodities such as iron ore, copper, crude, etc.
To Know More, Do Read: Mid-Year Budget Lowers Iron Ore Price Forecast; Emerging High-Yielding Dividend Opportunity?
The futures contract prices of gold are perfectly reflecting the market anticipation of a tough time ahead (provided economic conditions remain slow) with far contract trading at relatively high prices as compared to the near futures, which further suggests that the convenience yield of gold is currently low as compared to its storage cost.
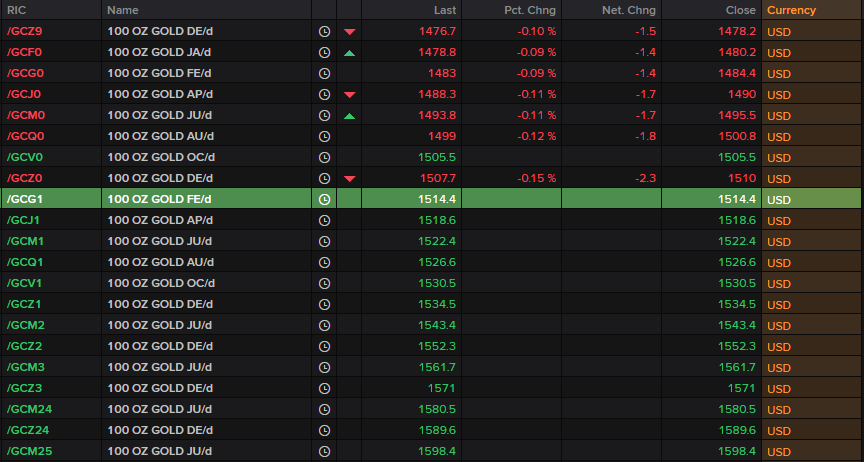
Comex Gold Futures (Source: Thomson Reuters)
To Know More, About Futures Related Technical Terms, Do Read: An Investorsâ Guide for Commodity Valuation and Mining Stocks
Gold Seasonality Indicates Turnaround

Gold Seasonality Chart (Source: Thomson Reuters)
Gold seasonality chart is clearly showing that the gold repeat same pattern in a year with slight variations at time, which could be accounted for shifts in geopolitical and fundamental factors, and it could be seen on the chart, that gold usually recovered in the past at the end of the year, which could bring a Christmas-cherish on the bullion investorâs face.
While the above study reflects that the gold prices might recover soon with decent long-term indication, it would be a show for the eye to witness if the ASX gold mining companies would gain the lost momentum. Especially when the gold mining companies are engaged in aggressive acquisition and development to take advantage of spiked gold prices in the market.
Also Read: Does Gold Investing Intimidate you? Discover the Right Parameters for Astute Judgement
Disclaimer
This website is a service of Kalkine Media Pty. Ltd. A.C.N. 629 651 672. The website has been prepared for informational purposes only and is not intended to be used as a complete source of information on any particular company. Kalkine Media does not in any way endorse or recommend individuals, products or services that may be discussed on this site. Our publications are NOT a solicitation or recommendation to buy, sell or hold. We are neither licensed nor qualified to provide investment advice.
