


_06_16_2026_05_20_09_929099.jpg)

Crude oil prices are rising, and energy players and investors are eyeing the market with high hopes as many industry experts estimate that the energy sector would dominate the anticipated uprise in the S&P500 Index.
The prices of Brent Futures on the International Commodity Exchange started the year with a bull-run to reach the level of US$75.60 in April 2019. However, the prices took a correction over the U.S-China trade war, but the global cues such as the tension between the United States and Iran, and attack of oil tankers in the Gulf of Oman supported the crude oil prices again.
Apart from such tensions, the positive gesture along the sidelines of G-20 by the leaders of the United States and China also improved the global outlook slightly, but many industry analysts predict that the impact of the re-escalated trade war would remain in the present year.
The recent stance of Russia and the OPEC cartel to curb the production of oil in the market is another supportive factor for oil; yet, the oil kingpin Saudi Arabia is offering contracts to inch up the production capabilities.
Over such ambiguous actions in the global economics, the energy investors are in a conundrum, and waiting on the sidelines to get a clear picture; however, the active traders and speculators are charging high in the market, which in turn, is providing the short-term support and uprise to the oil prices.
While the market is in due diligence, the United States Department of Energy Information Administration (or EIA), released its monthly report on the energy for July 2019.
EIA Short-term Energy Outlook:
Price Forecast:
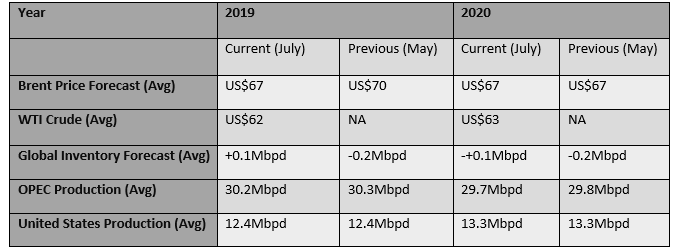
In its monthly report, the U.S. Energy Information Administration (EIA) forecasted that the Brent oil prices would average US$67 per barrel in 2H CY2019 (CMP US$67.41, as on 11th July 2019 8:03 PM AEST). The EIA further anticipates that the average prices would likely to remain at US$67 in the year 2020 as well.
On the West-Texas Intermediate or WTI-Crude oil, the organisation estimates an average level of US$62 per barrel for 2H CY2019 (CMP US$60.75 as on 11th July 2019 8:05 PM AEST) and US$63 per barrel in 2020.
The energy organisation reduced its average target of oil from US$70 per barrel in 2019 (anticipated in May); however, for 2020, the forecast of the Brent oil remained unchanged.
Global Inventory Forecast:
The U.S. EIA reduced the price forecast in its July 2019 report amid expectation of an increase in global production. As per the data, the EIA anticipates that the global oil inventories would mark an increase of 0.1 million barrels per day in CY2019 and CY2020. The organisation revised and upgraded its global oil inventory estimation from its previous projections.
In May 2019, the EIA anticipated that the global inventory would mark a decline of 0.2 million barrels per day in CY2019, and after than an increase of 0.1 million barrels per day in CY2020. The Energy administration mentioned that the week oil demand outlook for 2019 led towards the revision.
What remained unchanged from the previous forecast?
The EIA kept the overall OPEC and United States production forecast unchanged in its monthly report. As per the data, the average United States crude oil production is estimated to be 12.4 million barrels per day in CY2019 and 13.3 million barrels per day in CY2020.
The EIA further anticipates that the crude oil production from the Organization of the Petroleum Exporting Counties would average around 30.3 million barrels per day in 2019, down by over 5 per cent or 1.7 million barrels per day from the production of 2018.
The market speculators and traders are bullish on the oil over the estimated production decline from the OPEC cartel, which, in turn, is supporting the crude oil prices in the international market.
In a nutshell, the organisation forecast that the crude oil prices would average around US$67 in 2020 amid build-up in global inventory. While, the EIA also anticipates, that the United States would soon become a net exporter of oil in the market. The OPEC average production is expected to witness no sharp change. However, in its recent meeting, the cartel of oil-producing nations has decided to curb approx. 1.25 per cent of global demand.
There was no significant change in the EIAâs price and production outlook from its June forecasts.
Demand Forecasts:
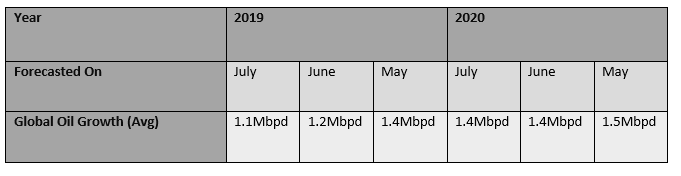
The United States Energy Information Administration anticipates that the global consumption of oil would grow at an average of 1.1 million barrels per day in 2019 and by 1.4 million barrels per day in 2020. The EIA revised and downgraded its global oil consumption forecast for the sixth consecutive month.
The organisation anticipated the global oil demand to grow on an average of 1.2 million barrels per day in 2019 and 1.4 million barrels per day in 2020, in its Juneâs estimation.
Likewise, the organisation forecasted the demand to grow at an average of 1.4 million barrels per day in 2019 and 1.5 million barrels per day in 2020, in its Mayâs estimation.
On the downgrade, the EIA mentioned that the downgrade is due to the slowing economic growth among significant oil-consuming nations. As per the data from EIAâs International Energy Statistics, the oil consumption in Q1 CY2019 among the OECD (Organization for Economic Corporation and Development) stood 350 thousand barrels per day lower than the EIAâs previous estimation.
The EIA also lowered its oil-weighted GDP growth projection to 2.2 per cent, which in turn, underpins the lowest annual growth rate since the year 2009.
Post addressing the EIAâs outlook on the oil, let us now have a look over the crude oil price scenario.
Crude Oil on Charts:
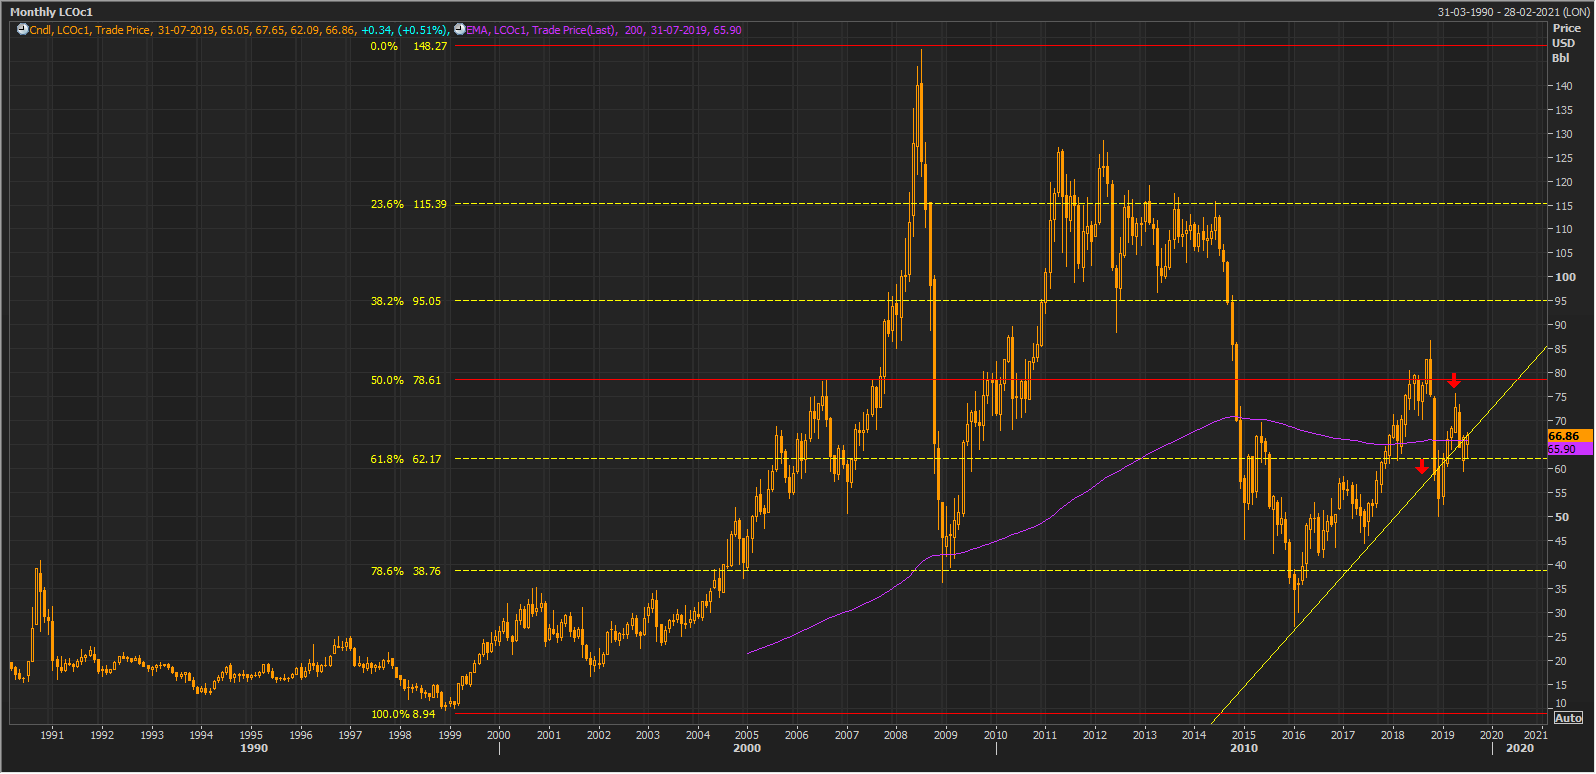
LCO Monthly Chart (Source: Thomson Reuters)
On a monthly chart, the crude oil prices presented a sharp up-rally, which corrected by more than 78.6 per cent, and started rebounding post the correction. Previously crude oil prices broke the support of the upward sloping yellow trendline and fell; however, the prices again rose and are currently facing the resistance (approx. US$67) of the previous support (upward sloping trend line).
The prices recently crossed the 200-days exponential moving average, which is at US$65.90, and the investors should keep a close eye in the range from (US$65.90-US$67) on the monthly chart, as a break below or failure to do so would decide further prices actions in it.
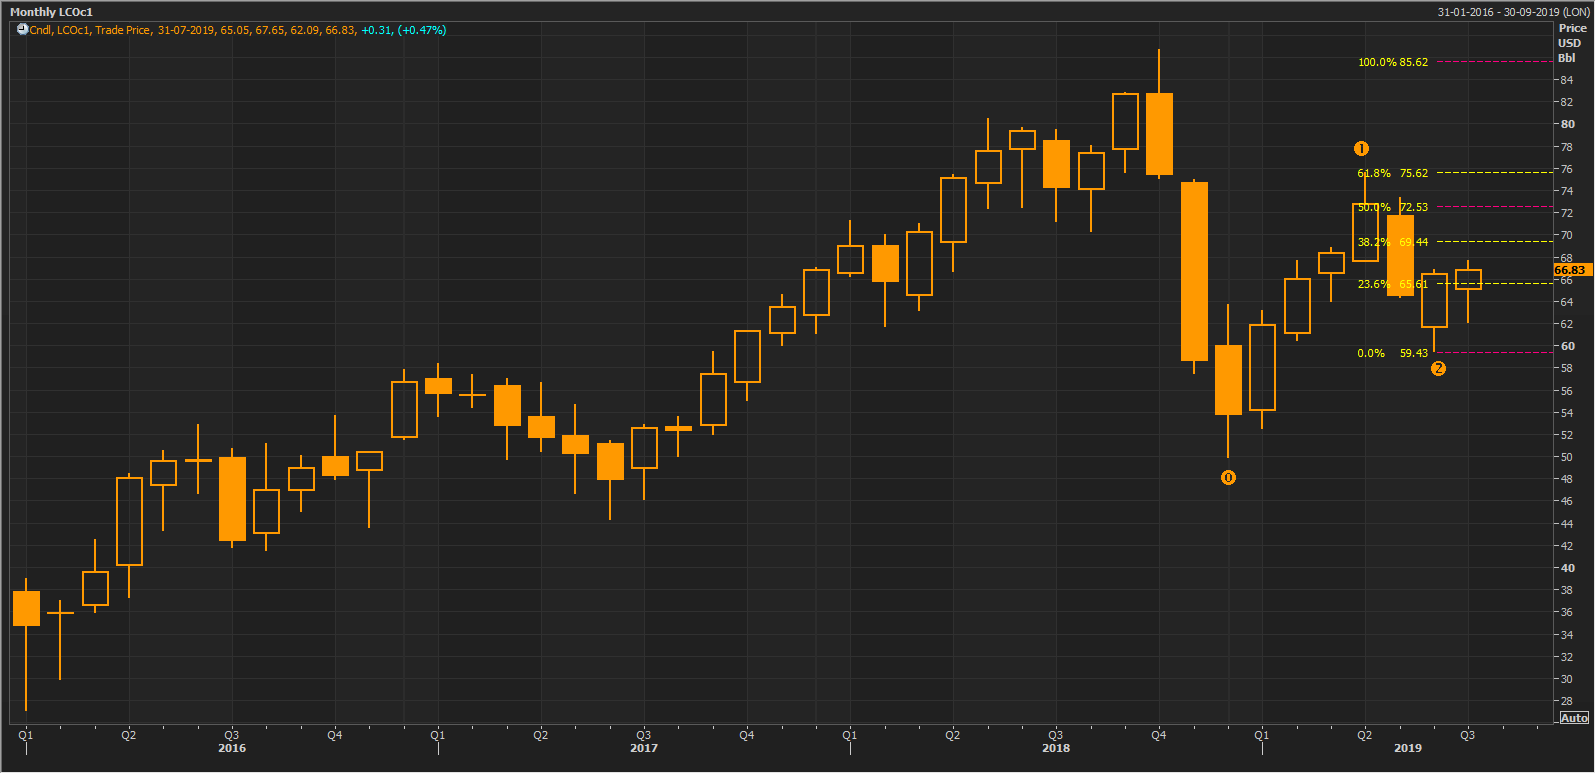
LCO Monthly Chart (Source: Thomson Reuters)
On a monthly chart, the prices rose and corrected without breaching the previous low (marked as 0), which in turn, presented the ideal coordinates for the Fibonacci Series. The results of the Fibonacci projections are shown in the chart above.
Crude on a Daily Chart:
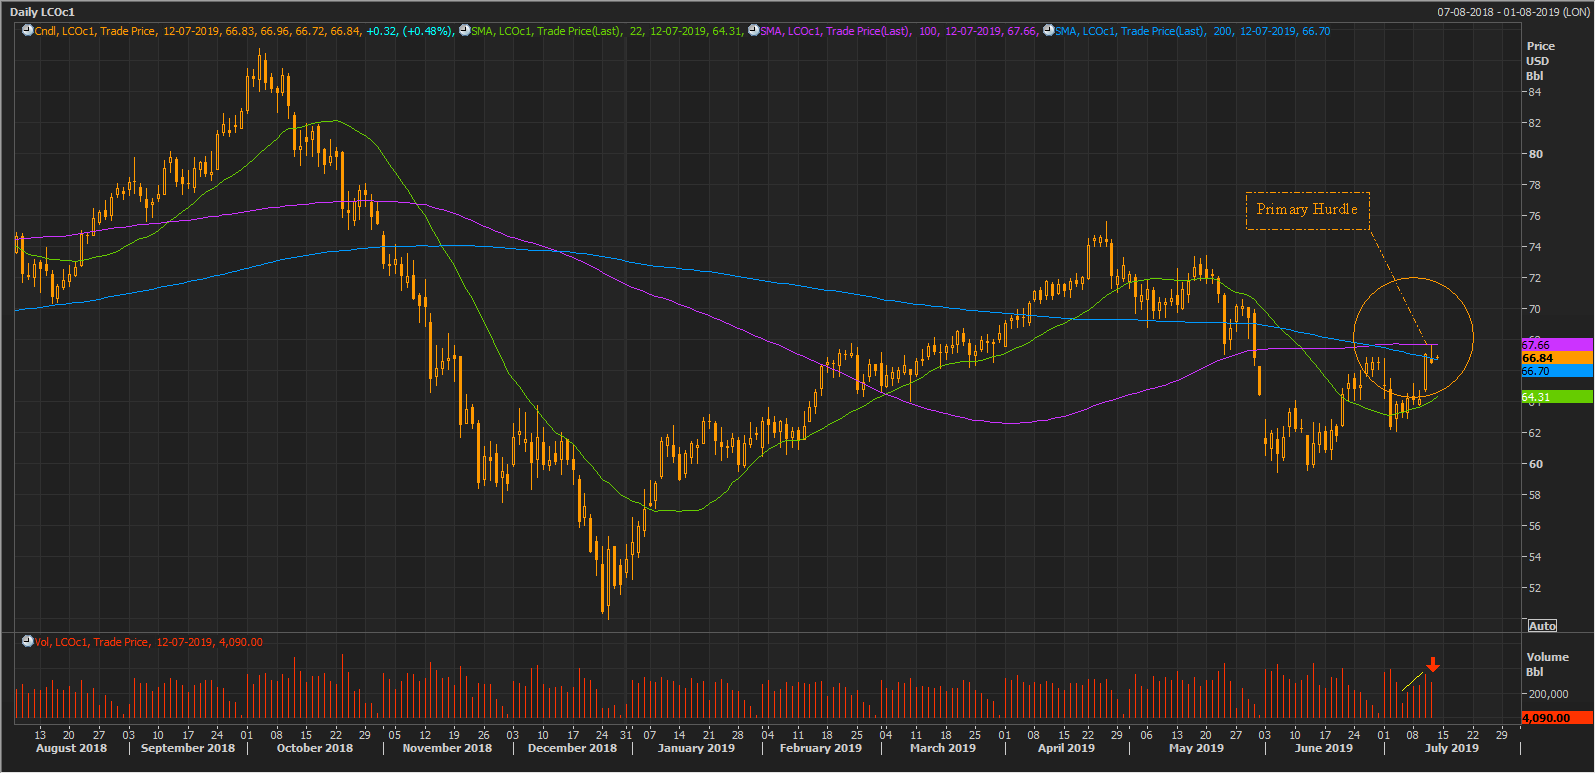
LCO Daily Chart (Source: Thomson Reuters)
On a daily chart, the crude oil prices are forming a Golden Cross (bullish signal) of 200 and 100-days simple moving averages (SMAs). The value of 200 and 100-days SMA stands at US$66.70 and US$67.66, respectively. However, the recent bull candle on 11th July 2019 has witnessed a decline in volume and the prices would now likely to face the hurdle of the 100-days SMA, which is at US$67.66.
Investors should keep a close eye around the level of US$67.66, as a break above and failure to do so would decide further price actions in the crude oil.
In a nutshell, the United States Energy Information Administration is bearish on in its July outlook amid weak demand estimations, and on the charts, the prices are witnessing a decline in volume and hurdle in the range of US$66.66-US$67.50.
The speculative bull rush is now likely to end, and investors should monitor the mentioned level to time the entry in the oil market.
Disclaimer
This website is a service of Kalkine Media Pty. Ltd. A.C.N. 629 651 672. The website has been prepared for informational purposes only and is not intended to be used as a complete source of information on any particular company. Kalkine Media does not in any way endorse or recommend individuals, products or services that may be discussed on this site. Our publications are NOT a solicitation or recommendation to buy, sell or hold. We are neither licensed nor qualified to provide investment advice.
