


In 2019, Australia overtook Qatar and topped the rank in world LNG exporter. The country exported around ~78 million tons of LNG at ~$49 billion. As full year production numbers have not been published by other countries yet, let us look at what happened till last quarter of 2019.
The country's LNG is mostly sold at oil-linked contract prices to Asian countries. The major export destinations for Australia have been Japan and China followed by South Korea, Taiwan and India.
Australian LNG export market 2018
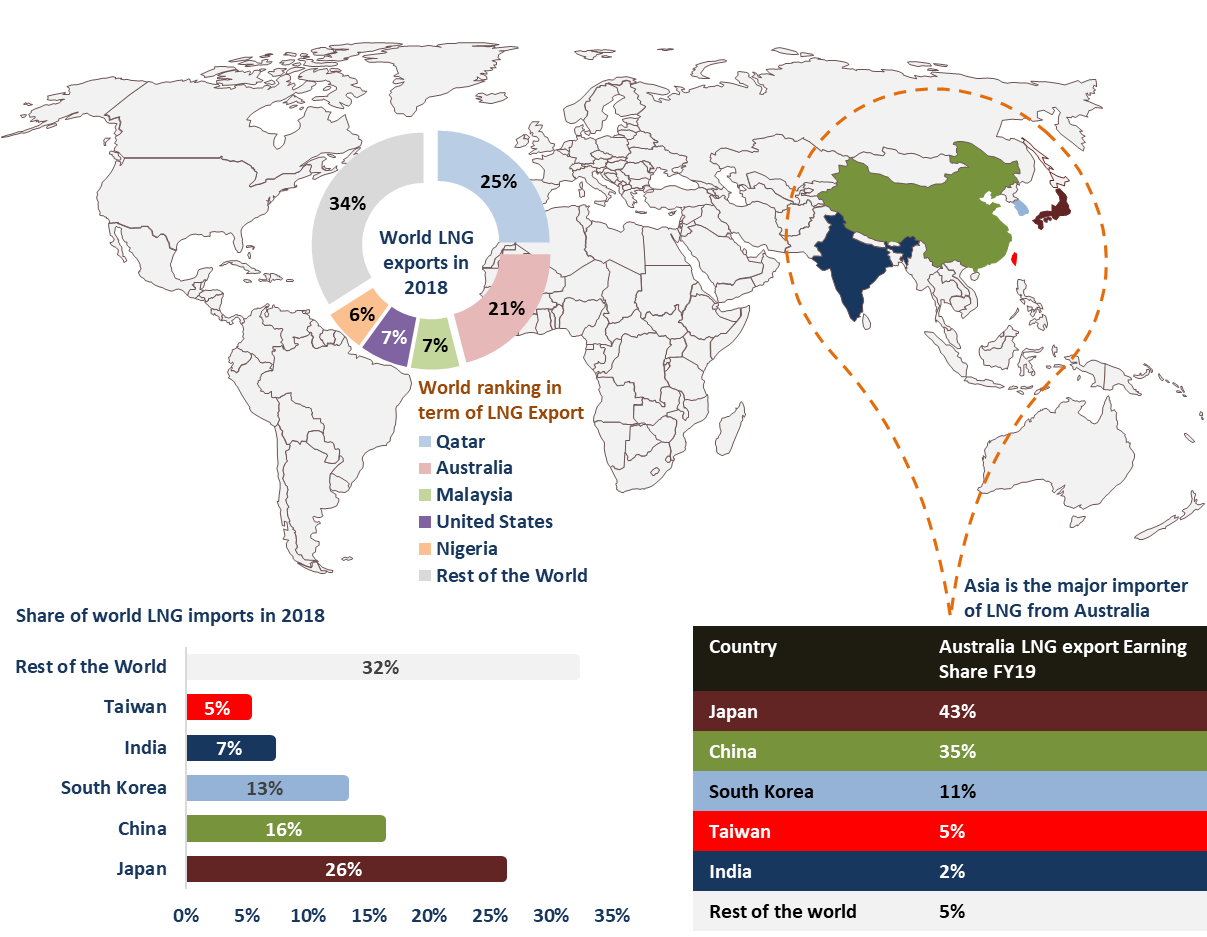
Source: Department of Industry, Innovation and Science and Kalkine Research
Australia's LNG export is expected to increase from 78 million tons FY19 to 81 million tons in FY20 and then anticipated to hover around the same value in FY21. The expected increase in export volume this year is primarily due to the upcoming projects in the country. However, despite the increase in export volume, the value or worth of the export is forecast to decrease from $49 billion in 2019, mainly due to the decline in oil-linked contract prices.
The LNG market has matured and now putting downward pressure on the spot prices due to the overcapacity coming from new projects and ramping operations in Australia, US and Russia. Also, in the meantime, demand from China, Japan and South Korea has declined.
Why weak demand for LNG exists even at lower spot prices?
LNG is traded in Asia through long term contracts, and in 2018 around 70% of the contracts were long term. These long-term contracts are generally linked to the price of oil i.e. Japan custom cleared crude (JCC) oil price which has a time lag of several months of the actual spot price. The difference between the long-term contract and spot prices though is decreasing as buyers are moving towards spot cargoes purchase which gives them flexibility in contracts.
The prices in the spot market are fundamentally driven by supply and demand where it’s been noticed that there are monthly spikes in prices averaging to lower year-on-year (Y-o-Y) prices. For example, in December 2019 quarter, Asian LNG spot price increased by ~25% from September 2019 quarter to average estimated spot price of ~US$5.70 per million British thermal units (MMbtu) or A$8.80 a gigajoule (GJ). Yet Y-o-Y prices were lower by 40%. The rise in price in the last quarter was due to the seasonal winter demand from the northern hemisphere, minor disruption in supply, while the friction between the US and Qatar also supported the price.
Having said that, in the long run lower spot price may persuade the buyers to alter the current oil-linked price with gas-based pricing system due to its nature of flexibility and shorter contracts.
Please click To Know How Plunge in LNG Prices May Augment the ASX Energy Stocks
Supply
LNG global supply capacity has been increased from the last few years and it is expected to continue in the near term as well due to the upcoming commercialization of projects and ramp-up of operations. World’s largest exporters Qatar and Australia have contributed around 46% of the total export market in 2018. In 2019, Australia surpassed Qatar in the top ranking by shipping ~4% more than Qatar.
The increase in Australian export market is mainly due to the commissioning of the projects in the country. The upcoming 10 projects are expected to increase the nameplate capacity of Australia to 88 million tons per annum.
The project details
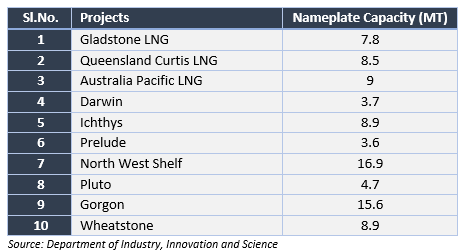
However, the top position is not going to last long with a recent announcement to construct two new LNG mega trains by Qatar Petroleum. With these upcoming projects, Qatar is expected to surpass present production capacity of 77 million tons per annum by 64% to 126 million tons by 2027.
The third and fourth position is secured in the LNG export market by Malaysia and US in 2018 with almost the same share, which is expected to show some gap in future. US LNG exports are expected to grow due to the ramp-up of new projects and commissioning of trains by three of its liquefaction facilities. With this combined US forecast to stand on the third position in world LNG export market holding 70 million tons per annum of nameplate capacity by 2021.
Demand
The demand from major importer Japan is forecast to decline due to the return of nuclear power generation by the country. The LNG imports are predicted to plunge from ~81 million tons in 2018 to ~75 million tons in 2021. Apart from the pace of nuclear restart, fall of energy requirement due to the improved energy efficiency and muted economic growth has resulted in lower demand.
China’s demand for LNG is expected to grow slowly due to the increased gas stockpiles and relaxing coal to gas switching policy owing to the slowing economic progress and low coal price giving the flexibility to choose the fuel by the consumers.
The other countries such as South Korea followed by Asian countries such as India, Malaysia, Bangladesh, Pakistan, Indonesia and Thailand are expected to grow significantly, driving LNG demand. The combined contribution by Asian economies is set to bypass the total demand of China by 2021.
LNG Demand and World Supply Capacity*
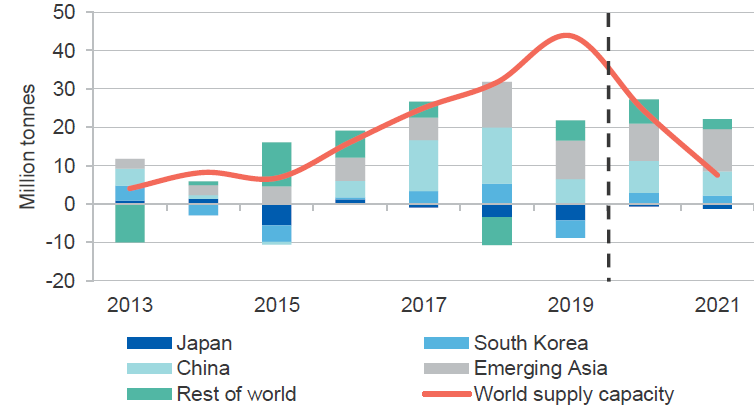
*2019 data is an estimate
Source: Department of Industry, Innovation and Science and Nexant
Good Read: How is the Australian economy placed? Lens through Key Economic Challenges
The LNG supply market seems to be oversupplied for the next two years and slowing dramatically at the end of 2021 due to the completion or ramping of the LNG projects. While the demand is expected to absorb the supply post-2021, rebalancing the LNG market. Also, the export earning is forecast to tumble due to the falling oil-linked contract prices. However, the Australian market is expected to compensate with its volume of sale as the supply capacity is likely to increase due to the ramping and commercialization of projects.
Disclaimer
This website is a service of Kalkine Media Pty. Ltd. A.C.N. 629 651 672. The website has been prepared for informational purposes only and is not intended to be used as a complete source of information on any particular company. Kalkine Media does not in any way endorse or recommend individuals, products or services that may be discussed on this site. Our publications are NOT a solicitation or recommendation to buy, sell or hold. We are neither licensed nor qualified to provide investment advice.
