


The S&P/ASX 200 Energy Index, which includes the companies involved in the exploration, production, marketing, and services related to oil & gas, has delivered a decent performance for the decade. The total returns from the index have surpassed returns from many heavyweights of S&P/ASX 200.
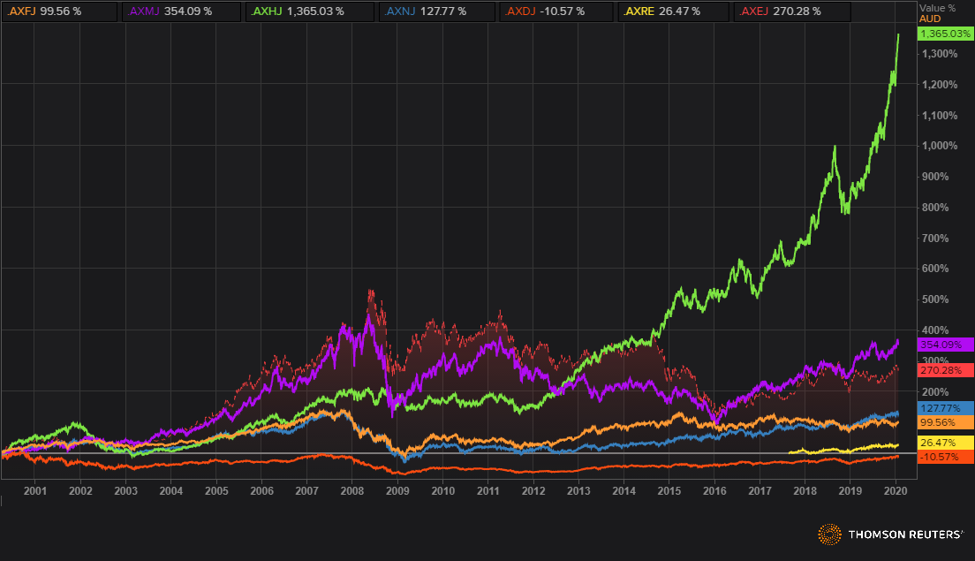
S&P/ASX Sectoral Indices Performance (Source: Thomson Reuters)
While accounting for just ~5.75 per cent of the capitalisation-based S&P/ASX 200 Index, the energy sector has outperformed many heavyweight of S&P/ASX 200 such as the financial sector (~28.31 per cent), industrial sector (~8.5 per cent), consumer discretionary (~7.37 per cent), and the real estate sector (~7.34 per cent).
Interestingly only the health care sector and the material sectors have outperformed the energy sector.
While the S&P/ASX 200 is trading close to record highs, the S&P/ASX 200 Energy Index is also a relatively stable performer and has contributed significantly to the benchmark index rally.
Also Read: Amidst Multiyear Index Highs, Resource Stocks-PRU, AWC, and S32 Announce Quarterly Report
Post reporting quarterly performance of resource companies and of top gunners on the exchange, let us look at the quarterly performance of energy companies on ASX.
Resource Players Quarterly Performance: Quarterly Bells Ring For Lynas and Mount Gibson; While Sandfire Receives Strong Expansion Results; (LYC, MGX, PRU, AWC, S32, RIO, and RSG).
The limited resources of oil and higher LNG export, have kept the demand for natural gas alive on the domestic front and has acted as a major cushion for the energy companies on ASX.
Also Read: Assessing the Impact of Rising Oil Prices on the Domestic Gas Production
Beach Energy Limited (ASX:BPT)
BPT is an ASX-listed oil & gas exploration company with permits in Cooper Basin and many on-shore and off-shore production tenements. BPT also holds various gas sales contract across the energy retailers and industrial users for its Western Flank oil and gas operations in Cooper Basin.
- Performance Highlights
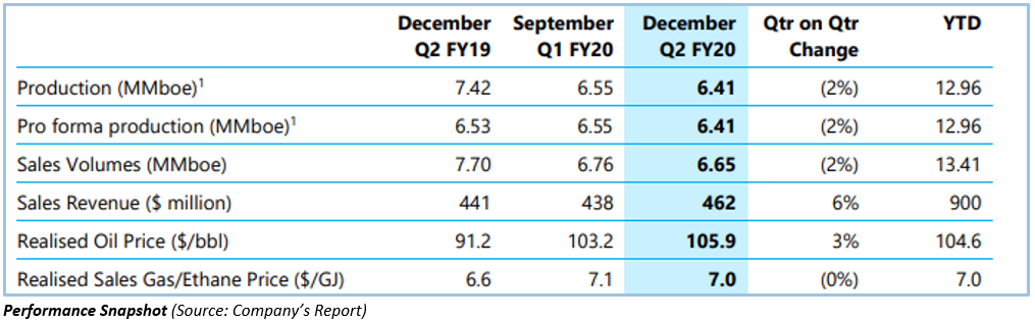
The company presented its FY20 second-quarter report for stakeholders today for the quarter ended 31 December 2019.
The oil production dropped by 2 per cent against the previous quarter to stand at 6.41 million barrels of oil equivalent. The sales volume also took a hit during the quarter with the volumes standing at 6.65 million barrels of oil equivalent, down by 2 per cent against the September Q1 FY20.
However, despite lower sales and production volume, the sales revenue surged by 6 per against the previous quarter to stand at $462 million in December 2019 quarter or Q2 FY20.
The gain in revenue came on back of the increase in average realised price during the quarter, which stood at $105.9 per barrel, up by 3 per cent against the previous quarter. The average gas sales/ethane realised price stood at $7.0 gigajoule unchanged as compared to the previous quarter.
- Reasons for decrease in production and sales
While the oil production at the Western Flank surged by 13 per cent to stand at 1.8 million barrels and operated Western Flank oil production stood at 22,700 barrels of oil per day (gross) by the end of December 2019, the overall group quarterly production declined due to the scheduled shutdown of Kupe plant and lower gas customer nominations.
- Corporate financial position
BPT incurred a capital expenditure of $209 million during the quarter, which remained down by 2 per cent against the previous quarter. The exploration and appraisal expenditure accounted for $63 million, unchanged against the previous quarter.
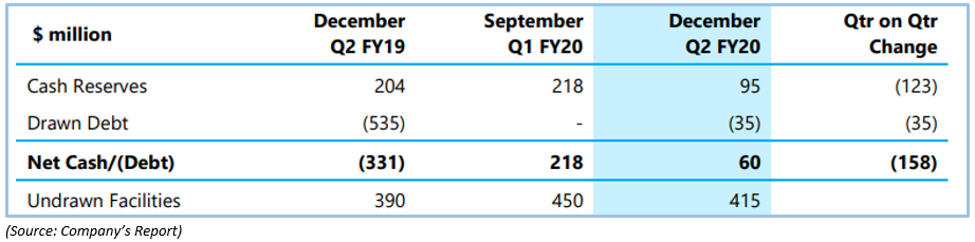
The company ended the December 2019 quarter in a net cash position with $95 million cash reserves and $35 million drawn debt, with undrawn $415 million revolving credit facilities. The liquidity stood at $510 million at the end of the FY20 quarter or December 2019 quarter.
Below is the table for material cash flows for the quarter:
The stock of the company last traded at $2.550 (as on 29 January 2020), down by 1.92 per cent against its previous close on ASX.
Senex Energy Limited (ASX:SXY)
SXY an oil & gas exploration company with permits across Surat/Bowen Basin and Cooper/Eromanga Basin. The company operates around ten oil fields through which it produces over one million barrels of oil annually. The operation portfolio of SXY includes Western Flank in Cooper Basin, Moomba transportation hub (in east, north, and south), and Western Surat Gas Project consist of Roma North and Project Atlas, both of which the company recently developed on schedule and budget.
To Know More, Do Read: ASX Oil & Gas Explorers Gain Momentum on ASX; -SXY, FAR, STO, and CVN
- Performance Highlights
SXY recently announced its quarterly highlights for the quarter ended 31 December 2019, which marked the second quarter of the financial year 2020 (Q2 FY20) for the company.
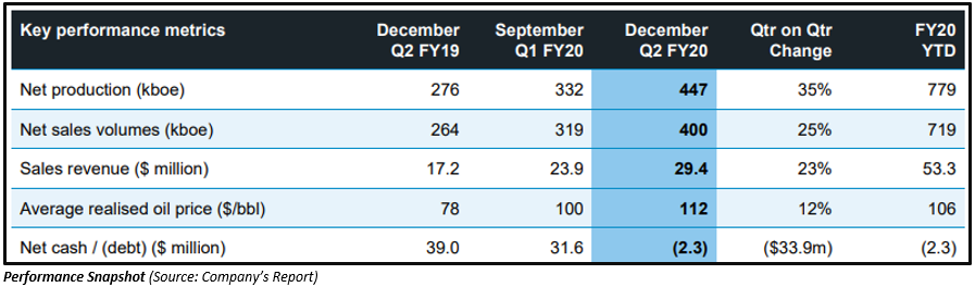
During the quarter, the net production surged by 35 per cent against the September Q1 FY20 quarter to stand at 447k barrels of oil equivalent. While the net production increased by 35 per cent, the net sales volume soared by 25 per cent against the previous quarter to stand at 400k barrels of oil equivalent.
The sales revenue during the quarter stood at $29.4 million, up by 23 per cent against the previous quarter. The average realised price witnessed a surge of 12 per cent to stand at $112 during the December 2019 quarter.
- Pivotal highlights
The continuing Roma North ramp up, and initial output from Project Atlas and the Gemba field supported the production with Roma North production exceeding 13.5 terajoules per day and production from the Project Atlas exceeding 6.5 terajoules per day from 23 wells, drilled during the early ramp-up phase.
So far, SXY has drilled 49 wells in the Surat Basin out of which 33 remain in production, and rest are estimated to come online over the coming weeks.
The sales are well supported from the offtake agreement secured by SXY for Project Atlas, which now accounts for sales volume over 32 petajoules from six customers.
At the Gemba field, SXY completed the free-carry drilling program during the quarter and identified material exploration targets from Westeros 3D survey.
- Corporate Financial Positions and Hedging
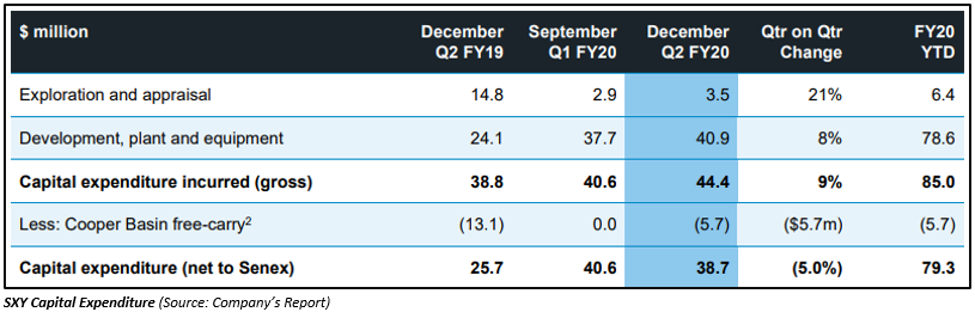
The company incurred a net capital expenditure of $38.7 million during the quarter, which remained 5.0 per cent down against the previous quarter; however, the gross capital expenditure surged by 9 per cent on a quarterly basis to stand at $44.4 million, which once netted against the $5.7 million due to free-carry at Cooper Basin reduced the net capital expenditure during the quarter.
Out of the total gross expenditure, the exploration and appraisal expenditure stood at $3.5 million, up by 21 per cent against the previous quarter.
SXY ended the quarter with a cash reserve of $122.7 million and a drawn debt of $125.0 million, which left the net debt at $2.3 million (at the end of Q2 FY20).
The stock of the company last traded at $0.310 (as on 29 January 2020), down by 3.12 per cent against its previous close on ASX.
Key Takeaways
- The S&P/ASX 200 Energy Index has delivered decent performance for the decade.
- While accounting for just ~5.75 per cent of the capitalisation-based S&P/ASX 200 Index, the energy sector has outperformed many heavyweights of S&P/ASX 200.
- BPT quarterly oil production dropped by 2 per cent, while sales volume plunged by 2 per cent as well.
- Despite lower production, the quarterly revenue for BPT surged by 6 per cent amid higher realised price for oil and gas sales.
- SXY quarterly production soared by 35 per cent, while net sales surged by 25 per cent on a quarterly basis.
- The quarterly sales revenue for SXY increased by 23 per cent over the higher sales volume and realised price.
