
.jpg)

Value style is perhaps one of the most practiced approach when it comes to stocks selection. History has proved that finding stocks that are priced below their true value is a time-honoured investing strategy. Investors always juggle between lucrative value bargains, as some are hard to resist while others are not always worth what they’re paying. To aid with this, various fundamental metrics are taken into consideration.
Bargain Stocks and P/E Ratio- The Concept
One common fundamental metric that is taken into consideration to determine the appropriateness of a stock in investing portfolios is the price to earnings ratio (P/E Ratio). Often referred to as the price multiple or the earnings multiple, the P/E ratio is a common financial ratio used for valuing a stock. It is used by analysts and investors alike to ascertain the relative value of shares of a company, in an eye-to-eye evaluation.
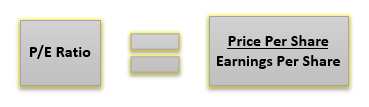
It is further used to compare the company against itself, that is, with its chronological record or aggregate markets with each other. The below formula helps in calculating the P/E ratio-
It should be noted that-
- A high P/E ratio denotes the overvaluation of the company's stock, with investors anticipating high growth rates in the future. Breaking it down, investors pay more for each unit of net income for these stocks.
- A low P/E ratio, on the other hand, denotes that a stock is relatively under-valued, and investors are sceptical about future earnings and business prospects.
Drawback of using PE
- Companies with no earnings and on a loss, trajectory have an irrelevant P/E ratio as there is no earnings per share (EPS) to calculate particularly high growth firms. This ratio does not come handy in such cases.
Now that we have understood P/E ratio, let us acquaint ourselves with value stocks, often referred to as bargain stocks. These are stocks that trade at a lesser price compared to its fundamentals intrinsic value. Value stocks are identified by the following characteristics-
- a high dividend yield
- low market multiples, such as P/B ratio and/or a low P/E ratio
- usually, the company is facing a headwind, be it in the form of negative business update, market related negative news, excessive competition etc.
- The revival visibility is usually lower for such businesses and thus adds to the uncertainty
Bargain Stocks with low P/E Ratio
Benjamin Graham, the father of value investing believed that the lower is the PE the better. Even though these tips are more than 50 years old, the human psychology has pretty much remained unchanged, and thus the tips hold true even today.
In general, investors like low P/E stocks because it indicates undervaluation and undervalued stocks have the potential to yield better returns. However, a disclaimer at this juncture is important- relying merely on low P/E ratio for stock picking is not advisable.
Value investors are often on a look out for stocks with comparatively low P/E ratios as a way for tapping cheaper stocks that the market has essentially passed over. Moreover, a low P/E stock with strong balance sheet stands a better chance of witnessing a future price appreciation as strong financials help the company to endure the downturns much better as against the weaker balance sheet ones, as these businesses have better capacity to suffer.
In this context, let us explore two large cap stocks depicting value attributes and presently available with a relatively low P/E ratio when compared to other players of their industries:
Air New Zealand (ASX: AIZ)
Focused on connecting New Zealand to the world, AIZ is a world-class airline and recently bagged the Sustainable Business Leadership award at the Deloitte Top 200 awards in Auckland. It has a competitive advantage especially in the Pacific Rim. Its network extends from New Zealand to Australia, the Pacific Islands, Asia, North and South America, and the United Kingdom.
The Company has recently launched its new regional lounge in Nelson, which was part of a $60 million investment in lounges across New Zealand in the next couple of years. The lounge was up and running prior to Christmas.
Dual listed on the New Zealand Stock Exchange (NZX) and the Australian Stock Exchange (ASX), AIZ closed higher at $2.840, down by 1.38% relative to its last close on 6 January 2020 and has a market cap of $3.23 billion. The stock has an annual dividend yield of 7.27% and is currently available at a P/E ratio of 12.34x.
Let us compare it to its peer, Qantas Airways Limited (ASX:QAN), which is currently available at a slightly higher P/E ratio of 13.110x and settled the day’s trade at $7.000, down by 2.64% (also expensive than AIZ) with a market cap of $10.67 billion, while the PE might not be revealing the relative overvaluation of QAN as against AIZ, the dividend yield definitely does, as QAN is trading at a dividend yield of mere 3% (as on 06 Jan 2020 closing) .
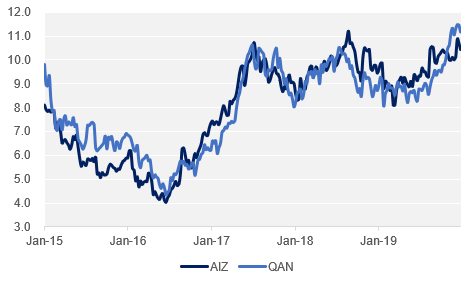
Historical NTM P/E ratio of QAN and AIZ (Source: TR, Kalkine)
The P/E of both the companies has closely tracked each other but the spread seems to have been noticeably widened in the last three months, with QAN now available at a slightly higher P/E valuation. Historically, AIZ has commanded a higher PE as compared to QAN, as noted in the above chart.
Dexus (ASX:DXS)
A leading Australian real estate group, DXS manages a high-quality Australian property portfolio which is valued at approximately $31.8 billion. The stock settled the day’s trade lower on 6 January 2020, closing at $11.9, down by 0.08% relative to its last close. With a market cap of $ 13.06 billion, it has an annual dividend yield of 4.2% and is currently available at a P/E multiple of 9.56x.
Comparing it with another real estate stock on the ASX, Goodman Group (ASX: GMG) which has a P/E multiple of 14.95x, it can be inferred that DXS is comparatively cheap. GMG last settled at $13.580 on 6 January 2020 and has a market cap of $24.68 billion.
DXS recently notified about a $656 million boost from independent valuations, it should be noted here that there was valuation rise across DXS’ industrial portfolio, with continued capitalisation rate compression at properties through key Eastern seaboard markets supported by an upsurge in transactional evidence. The Company expects to see further valuation increases over the next six to 12 months as the market awaits its 2020 half year results due on 6 February 2020.
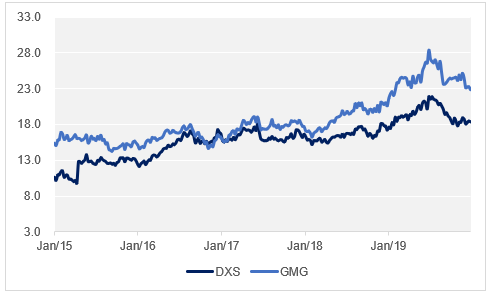
Historical NTM P/E ratio of QAN and AIZ (Source: TR, Kalkine)
From the above comparative charts, it’s quite evident that DXS is currently undervalued as against GMG. The gap between the two has widened.
With the new year just in, companies across the Australian share market are thriving to meet their new set of goals and attract shareholders, working on fundamentals that drive good investment. Even though one core fundamental should never form the basis of stock selection, P/E ratio could be a quick and convenient valuation ratio.
Disclaimer
This website is a service of Kalkine Media Pty. Ltd. A.C.N. 629 651 672. The website has been prepared for informational purposes only and is not intended to be used as a complete source of information on any particular company. Kalkine Media does not in any way endorse or recommend individuals, products or services that may be discussed on this site. Our publications are NOT a solicitation or recommendation to buy, sell or hold. We are neither licensed nor qualified to provide investment advice.
