


Gold spot price (XAU/USD) at the time of writing was noted down at the price of US$1411.35 on July 15, 2019. It has breached an important resistance level on a weekly timeframe chart at US$1,396.85, which indicates a higher probability for a fresh new upside rally. The main reason for this rise can be attributed to uncertainty arising due to geo-political tensions and prompting a shift of the global investment towards safe asset class such as gold. As per the media reports, the US-Iran tensions are rising in the Gulf reason. Iran recently broke 300 Kg cap on enriched Uranium stockpile along with shooting down the US drone, leading to a war like situation. The present circumstance is expected to affect global oil supplies, leading to a decrease in the global growth rate forecast. Moreover, market sentiments also turned positive towards gold investments when US Fed Chairman, Jay Powell said that they will act appropriately to deal with the current situation, which gave a hint for a rate cut to boost slowing business investments.
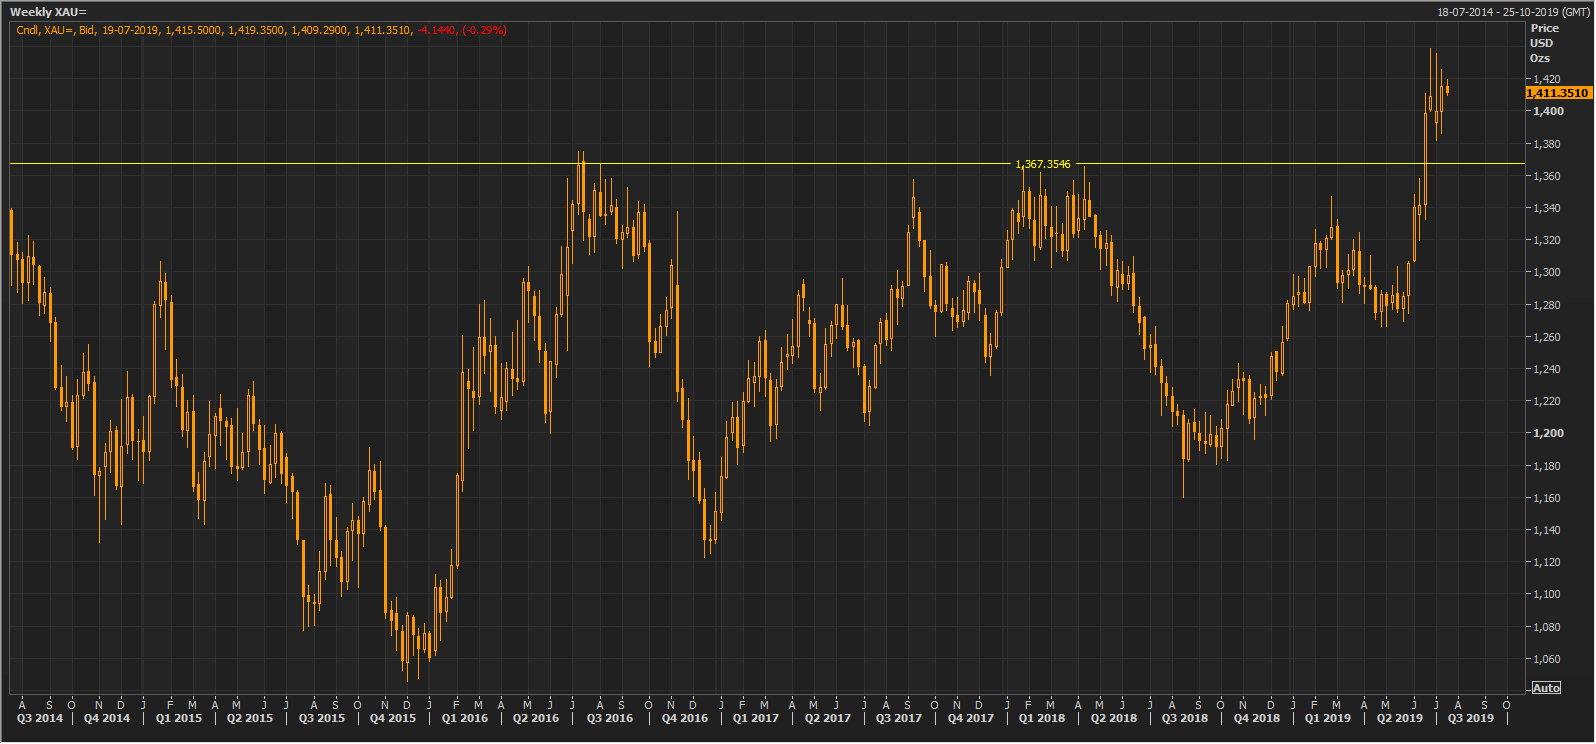
XAU/USD Price Movement (Source: Thomson Reuters)
This gold price increase is expected to have a positive impact over the income statement of the gold explorers, miners, producers and developers. Five important Australian Gold companies with a market capitalisation above $2 Bn are NewCrest Mining Limited, Northern Star Resources Ltd, Evolution Mining Limited, AngloGold Ashanti Limited and OceanaGold Corporation. Letâs have a look over their recent updates along with stock price performance.
NewCrest Mining Limited (ASX:NCM)
NewCrest Mining Limited (ASX:NCM) recently announced a change in the interest of its substantial holder, where Allan Gray Australia Pty Ltd and its related bodies reduced their voting power from 8.77% to 7.76%, effective from June 27, 2019.
March â19 Quarter Key Highlights: Gold production for the period decreased by 5% to 623koz as compared to the previous quarter. Copper production in the period decreased by 6% to 25kt as compared to the previous quarter. The groupâs All-In Sustaining Cost (AISC) increased by $18 per oz to $738 per oz as compared to the previous quarter. The groupâs AISC margin increased by $48 per oz to $563/oz as compared to the previous quarter.
In another update, the company updated the market about its Joint Venture with Imperial Metals.
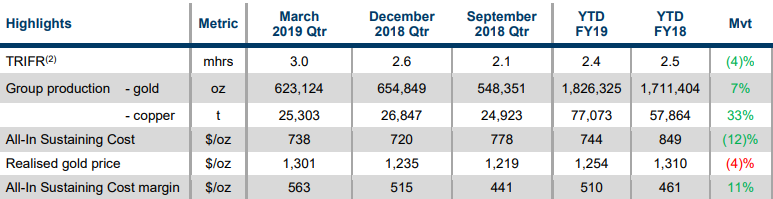
March â19 Quarter Key Metrics (Source: Company Reports)
On the stock information front, at market close on July 15, 2019, the stock of NewCrest Mining was trading at $31.990, up 0.503%, with a market capitalisation of ~$24.46 Bn. Its current PE multiple is at 50.560x and its last EPS was noted at 0.630 AUD. Its annual dividend yield stands at 0.8%. Today, it reached dayâs high at $32.100 and touched dayâs low at $31.730, with a daily volume of 1,610,578. Its 52 weeks high and low price stands at $32.740 and $18.575, with an average volume of 2,757,626 (yearly). Its absolute returns for the past one year, six months, and three months are 47.84%, 34.02%, and 24.77%, respectively.
Northern Star Resources Ltd (ASX:NST)
As per the announcement over ASX, Northern Star Resources Ltd (ASX:NST) is expected to release its quarterly report (ended June 30, 2019) on July 30, 2019. In a previous update, NST announced the appointment of its new Directors, Nicholas Luigi Cernotta and Mary Hackett in its Board, effective from July 1, 2019.
March â19 Quarter Key Highlights: NST for the period sold 185,296oz of gold at an All-In Sustaining cost of $1,369/oz. Its Australian operations sold around 149,069oz of gold at an All-In Sustaining cost of $1,200/oz, and its US operations sold around 36,227oz of gold at an All-In Sustaining cost of $2,062/oz. As per its quarter production, around 81,089 oz of gold was mined and 67,420oz sold at an All-In Sustaining cost of $1,021/oz from its Jundee Gold Operations. From its Kalgoorlie Gold Operations, 84,492oz of gold was mined and 81,649oz sold at an All-In Sustaining cost of $1,347/oz. From its Pogo Gold Operations, 39,750oz of gold were mined and 36,227oz sold at an All-In Sustaining cost of $2,062/oz.
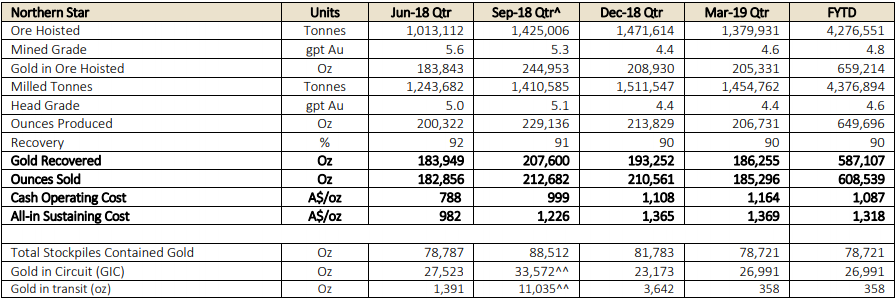
March â19 Quarter Key Metrics (Source: Company Reports)
On the stock information front, at market close on July 15, 2019, the stock of Northern Star was trading at $11.890, up 2.412%, with a market capitalisation of ~$7.43 Bn. Its current PE multiple is at 36.280x and its last EPS was noted at 0.320 AUD. Its annual dividend yield has been noted at 0.95%. Today, it reached dayâs high at $11.880 and touched dayâs low at $11.700, with a daily volume of 2,328,230. Its 52 weeks high and low price stands at $11.980 and $6.725, with an average volume of 3,202,637 (yearly). Its absolute returns for the past one year, six months, and three months are 59.04%, 23.51% and 25.79%, respectively.
Evolution Mining Limited (ASX:EVN)
Evolution Mining Limited (ASX:EVN) has recently announced its preliminary FY19 operating results and FY20 guidance, where gold production for June 2019 quarter was reported at 194,866 ounces as compared to 175,901oz in March 2019 quarter. The All-in Sustaining Cost (AISC) was reported at $915 per ounce as compared to $925/oz in March 2019 quarter. The operating mine cash flow for the June 2019 quarter was reported at $217.4 million as compared to $168.3 million in March 2019 quarter. The net mine cash flow for the quarter period was reported at $154.4 million as compared to $107.8 million in March 2019 quarter.
Its gold production for the financial year 2019 stood at 753,001 ounces, with All-In Sustaining cost of $924 per ounce. The operating mine cash flow for the FY19 stood at $773.6 million. The net mine cash flow for the financial year 2019 stood at $500.0 million.
EVN expects its FY20 gold production to be in between the range of 725,000 to 775,000 ounces of gold with All-In Sustaining cost to be in between the range of $890 to $940 per ounce.
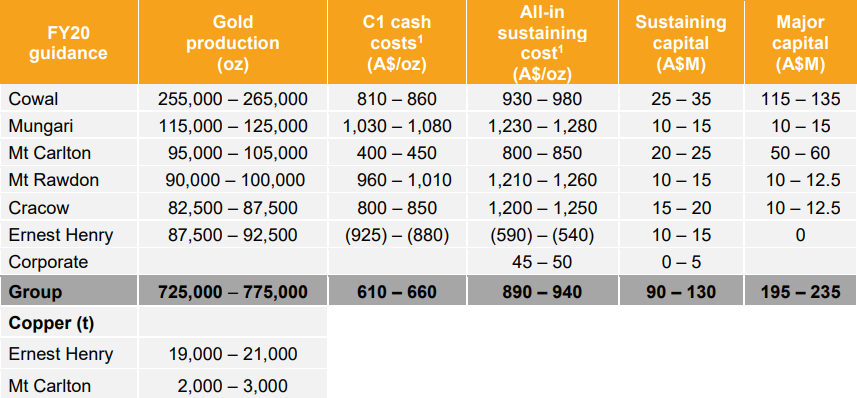
FY20 Production Guidance (Source: Company Reports)
On the stock information front, at market close on July 15, 2019, the stock of Evolution Mining was trading at $4.430, up 1.373%, with a market capitalisation of ~$7.42 Bn. Its current PE multiple is at 31.920x and its last EPS was noted at 0.137 AUD. Its annual dividend yield has been noted at 1.72%. Today, it reached dayâs high at $4.460 and touched dayâs low at $4.390, with a daily volume of 5,531,652. Its 52 weeks high and low price stands at $4.500 and $2.605, with an average volume of 9,585,629 (yearly). Its absolute returns for the past one year, six months and three months are 32.02%, 15.92%, and 22.07%, respectively.
AngloGold Ashanti Limited (ASX:AGG)
AngloGold Ashanti Limited (ASX: AGG) recently appointed an Independent Non-Executive Director, Ms Maria Ramos as to its Board of Directors with effect from 1st June 2019.
March â19 Quarter Key Highlights: The production for the period was reported at 752,000oz at an average total cash cost of $791/oz as compared to 824,000oz at $834/oz during the first quarter of last year. The All-in sustaining costs during the period fell by 2% to $1,009/oz over the same period. Despite the lower gold price and marginally lower production from certain assets, the company delivered a strong adjusted EBITDA margin of 37%.
AGG expects its full year production to be between 3.25Moz to 3.45Moz. The total cash costs are expected to be in the range of $730/oz and $780/oz. The All-in sustaining costs is expected to be in the region of $935/oz and $995/oz. The capital expenditure for the company is expected to be between $910 Mn and $990 Mn.
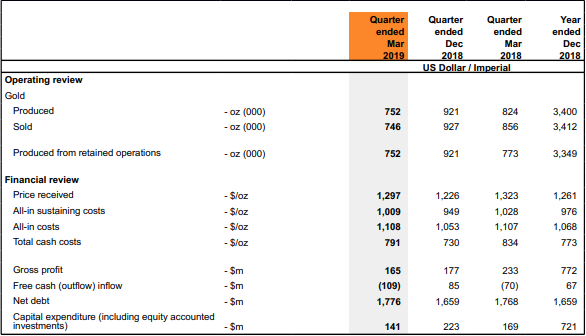
March â19 Quarter Key Metrics (Source: Company Reports)
On the stock information front, at market close on July 15, 2019, the stock of AngloGold Ashanti was trading at $5.100, down 1.923%, with a market capitalisation of ~$2.62 Bn. Its current PE multiple is at 1,368.420x and its last EPS was noted at 0.004 AUD. Its annual dividend yield has been noted at 0.29%. Today, it reached dayâs high at $5.200 and touched dayâs low at $5.100, with a daily volume of 2,946. Its 52 weeks high and low price stands at $5.350 and $1.980, with an average volume of 14,035 (yearly). Its absolute returns for the past one year, six months and three months are 124.14%, 43.65%, and 39.78%, respectively.
OceanaGold Corporation (ASX:OGC)
OceanaGold Corporation (ASX:OGC) updated investors that it will publish its second quarter ending June 30, 2019, financial and operational results, before the Toronto Stock Exchange open on Thursday, 25th July 2019. In a previous update, OGC announced that due to a scheduling conflict, the hearing date for an application for ruling in contradiction to the unauthorised restraint of the Didipio operation has been revised to a new date (July 12, 2019). The company informed that around 1,500 workers work at the Didipo Mine, which comprises 59% from local communities and 97% Philippine nationals. In addition, the company till now has delivered significant socio-economic benefits to the local communities.
March â19 Quarter Key Highlights: Revenue from the operation was reported at $179.5 Mn as compared to $196.7 Mn in the previous corresponding period. The net profit for the period was reported at $12.4 Mn as compared to $44.5 in the previous corresponding period.
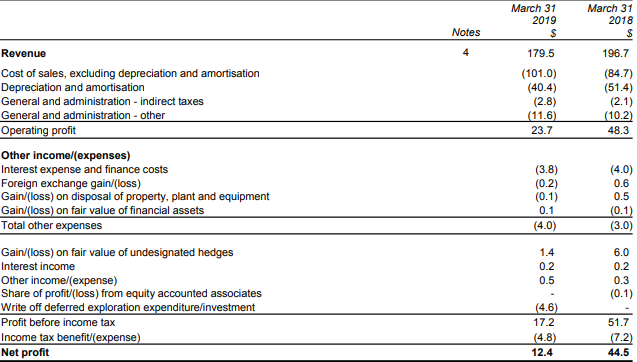
March â19 Quarter Key Metrics (Source: Company Reports)
On the stock information front, at market close on July 15, 2019, the stock of OceanaGold was trading at $3.660, up 0.826%, with a market capitalisation of ~$2.26 Bn. Its current PE multiple is at 12.810x and its last EPS was noted at 0.283 AUD. Its annual dividend yield has been noted at 0.85%. Today, it reached dayâs high at $3.730 and touched dayâs low at $3.650, with a daily volume of 384,635. Its 52 weeks high and low price stands at $5.280 and $3.360, with an average volume of 334,686 (yearly). Its absolute returns for the past one year, six months, and three months are -5.22%, -24.69%, and -15.97%, respectively.
Disclaimer
This website is a service of Kalkine Media Pty. Ltd. A.C.N. 629 651 672. The website has been prepared for informational purposes only and is not intended to be used as a complete source of information on any particular company. Kalkine Media does not in any way endorse or recommend individuals, products or services that may be discussed on this site. Our publications are NOT a solicitation or recommendation to buy, sell or hold. We are neither licensed nor qualified to provide investment advice.
