
 AUS
AUS
 NZ
NZ
 UK
UK
 CA
CA
 USA
USA
 IND
IND








Highlights
- com Inc reported a net income of US$468 million or US$0.47 per share diluted for the three months ended October 31, 2021.
- Merck & Company, Inc’s net income was US$4.57 billion or US$1.80 per share diluted for the September quarter of 2021.
- Intel Corp’s net income came in at US$19.87 billion or US$4.86 per share diluted in the fiscal year ended December 25, 2021.
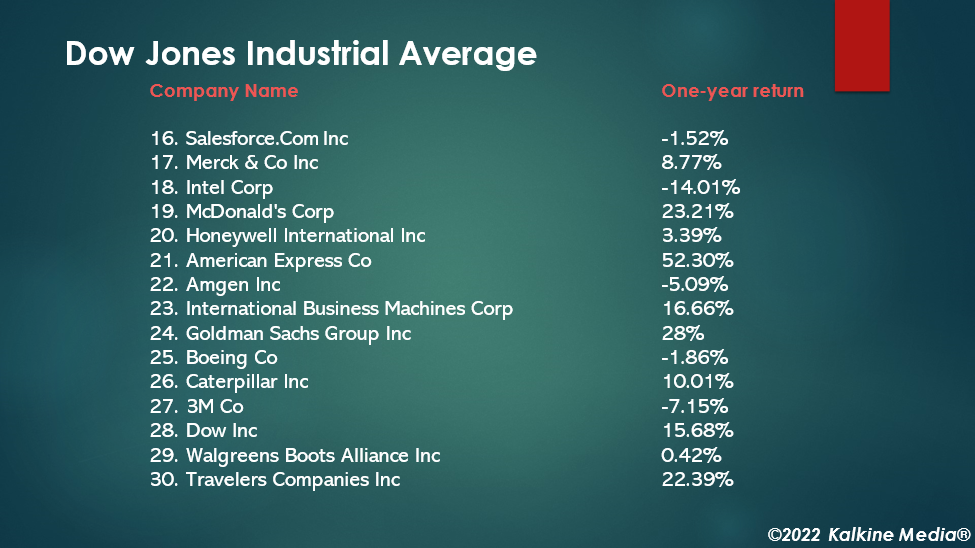
This is the second part of the article on the top 30 companies in Dow Jones. Please refer to Part I for other companies on the list.
Salesforce.com Inc (NYSE:CRM)
Market Cap: US$218.8 billion
Closing price on January 28, 2022: US$222.13
One year return: -1.52%
This San Francisco, California-based technology company provides enterprise cloud computing solutions as a software-as-a-service product.
For the three months ended October 31, 2021, the company reported revenue of US$6.86 billion and a net income of US$468 million or US$0.47 per share diluted.
Its P/E ratio is 122.72, and the forward P/E for one year is 91.79.
Also Read: Five energy stocks that gave over 100% return in a year
Merck & Company, Inc. (NYSE:MRK)
Market Cap: US$204.35 billion
Closing price on January 28, 2022: US$80.90
One year return: 8.77%
Merck & Company manufactures drugs for Hepatitis B, cancer, and cardiometabolic diseases. It also sells animal health-related medicines. It is based in Kenilworth, New Jersey.
For the September quarter of fiscal 2021, the company earned a net income of US$4.57 billion or US$1.80 per share diluted. It posted net sales of US$13.15 billion.
Its P/E ratio is 28.59, and the forward P/E for one year is 14.09. The dividend yield is 3.41%, with an annualized dividend of US$2.76.
Also Read: Stocks that could give FAANG companies a run for money
Intel Corporation (NASDAQ:INTC)
Market Cap: US$194.35 billion
Closing price on January 28, 2022: US$47.73
One year return: -14.01%
Based in Santa Clara, California, Intel designs and manufactures microprocessors for data center markets and personal computers. The company has also been expanding to artificial intelligence, the Internet of Things, and the automotive industry lately.
On January 21, Intel announced plans to invest over US$20 billion in the construction of two chip factories in Ohio.
For the fiscal year ended December 25, 2021, the company posted revenue of US$79.02 billion and a net income of US$19.87 billion or US$4.86 per share diluted.
Its P/E ratio is 9.82, and the forward P/E for one year is 13.56. The dividend yield is 2.91%, with an annualized dividend of US$1.46.
Also Read: In tit-for-tat move, US suspends 4 Chinese airlines in Omicron row
McDonald's Corporation (NYSE:MCD)
Market Cap: US$191.36 billion
Closing price on January 28, 2022: US$256.09222.13
One year return: 23.21%
McDonald's is a restaurant chain operator with roughly 39,680 stores in around 119 countries. More than 50% of its revenue come from franchise royalty fees and leases. The rest comes from the company-operated stores. It is based in Chicago, Illinois.
The restaurant company posted revenue of US$23.22 billion for the fiscal year ended December 31, 2021. Its net income was US$7.54 billion or US$10.04 per share diluted.
Its P/E ratio is 25.51, and the forward P/E for one year is 25.16. The dividend yield is 2.16%, with an annualized dividend of US$5.52.
Also Read: SEC gives nod to new US stock exchange with blockchain feed

Source – Pixabay
Honeywell International Inc. (NASDAQ:HON)
Market Cap: US$139 billion
Closing price on January 28, 2022: US$201.99
One year return: 3.39%
Honeywell provides thermostats. The Charlotte, North Carolina-based Honeywell entered into the performance management software segment in 2019.
For the three months ended September 30, 2021, the company posted net sales of US$8.47 billion. Its net income was US$1.27 billion or US$1.80 per share diluted.
Its P/E ratio is 25.96, and the forward P/E for one year is 25.12. The dividend yield is 1.94%, with an annualized dividend of US$3.92.
Also Read: A look at top 50 stocks by market cap on NASDAQ Composite (Part I)
American Express Company (NYSE:AXP)
Market Cap: US$134.7 billion
Closing price on January 28, 2022: US$177.06
One year return: 52.30%
American Express is a financial institution and operates in around 130 countries. Its three operating segments are global merchant and network services, global consumer services, and global commercial services.
The company posted total revenue of US$42.38 billion for the fiscal year ended December 31, 2021. Its net income was US$8.06 billion, or US$10.02 per share diluted.
Its P/E ratio is 134.7, and the forward P/E for one year is 18.39. The dividend yield is 0.97%, with an annualized dividend of US$1.72.
Also Read: Top 50 stocks by market cap on NASDAQ Composite (Part II)
Amgen Inc. (NASDAQ:AMGN)
Market Cap: US$129 billion
Closing price on January 28, 2022: US$229.14
One year return: -5.09%
The California-based Amgen is a biotechnology company specializing in renal disease and cancer care products.
Amgen earned revenue of US$6.7 billion and a net income of US$1.88 billion for the quarter ended September 30, 2021. Its EPS diluted was US$3.31 for the same period.
Its P/E ratio is 23.6, and the forward P/E for one year is 13.57. The dividend yield is 3.07%, with an annualized dividend of US$7.76.
Also Read: Top penny stocks to explore in February
International Business Machines Corporation (NYSE:IBM)
Market Cap: US$98.4 billion
Closing price on January 28, 2022: US$134.50
One year return: 16.66%
IBM sells IT-related products, including software and hardware, and offers consulting services. The company operates in around 175 countries and is headquartered in Armonk, New York.
For the fiscal year ended December 31, 2021, the company reported a net income of US$5.74 billion or US$6.35 per share diluted on the total revenue of US$57.35 billion.
Its P/E ratio is 21.18, and the forward P/E for one year is 13.61. The dividend yield is 4.88%, with an annualized dividend of US$6.56.
Also Read: Apple beats profit estimates as record iPhone sales lift results
Goldman Sachs Group, Inc. (NYSE:GS)
Market Cap: US$115.75 billion
Closing price on January 28, 2022: US$347.01
One year return: 28%
Investment bank Goldman Sachs will report its Q4 and fiscal 2021 financial results on February 24, 2022. For the September quarter of 2021, the bank earned total net revenues of US$13.6 billion. Its net earnings were US$5.28 billion or US$14.93 per share diluted.
Its P/E ratio is 5.85, and the forward P/E for one year is 8.74. The dividend yield is 2.31%, with an annualized dividend of US$8.00.
Also Read: Two food stocks to explore in February
Boeing Company (NYSE:BA)
Market Cap: US$112.2 billion
Closing price on January 28, 2022: US$190.57
One year return: -1.86%
Boeing is an aerospace and defense company based in Chicago, Illinois. Its four operating segments are defense, commercial airplanes, space & security, global services, and Boeing capital.
On January 27, 2022, the company received orders for four 777 freighters from the Taiwan flag carrier. It is expected to open new market opportunities for the company.
For the fiscal year 2021, the company reported revenue of US$62.3 billion and an operating cash flow of (US$3.4) billion. The net loss came in at US$4.29 billion or US$7.15 per share.
The aerospace company added 535 net commercial orders in fiscal 2021. It has a forward P/E for one year of 52.07.
Also Read: Falling prices stoke a winter of discontent for the crypto market
Also Read: Banks expect Fed to raise benchmark rate by 50 bps in March
Caterpillar, Inc. (NYSE:CAT)
Market Cap: US$108.8 billion
Closing price on January 28, 2022: US$201.16
One year return: 10.01%
The Illinois-based Caterpillar manufactures heavy equipment for the power and locomotive industries. Its four operating segments are construction industries, energy & transportation, resource industries, and Caterpillar Financial Services.
The capital goods company recorded net sales and revenue of US$50.97 billion, up 22% over the previous year. Its full-year profit came in at US$11.83 per share diluted in fiscal 2021.
Its P/E ratio is 16.99, and the forward P/E for one year is 16.34. The dividend yield is 2.21%, with an annualized dividend of US$4.44.
Also Read: Top EdTech stocks to explore in first quarter of 2022
3M Company Common Stock (NYSE:MMM)
Market Cap: US$93.26 billion
Closing price on January 28, 2022: US$163.1
One year return: -7.15%
3M or Minnesota Mining and Manufacturing is a multinational company founded in 1902. It has an advanced research and development lab and uses technology across its products categories.
It is based in St. Paul, Minnesota.
The company posted a 9.9% increase in net sales to US$35.4 billion YoY for the fiscal year 2021. Its net income was US$5.9 billion or US$10.12 per share diluted in FY 2021.
Its P/E ratio is 16.12, and the forward P/E for one year is 15.61. The dividend yield is 3.63%, with an annualized dividend of US$5.92.
Also Read: Top ETF trends to watch in 2022
Dow Inc. (NYSE:DOW)
Market Cap: US$43.09 billion
Closing price on January 28, 2022: US$60.04
One year return: 15.68%
The Michigan-based Dow Inc is a diversified chemical manufacturing company. Its three operating segments are Packaging & Specialty Plastics, Performance Materials & Coatings, and Industrial Intermediates & Infrastructure.
Its net sales for the fiscal year ended December 31, 2021, was US$54.97 billion, and the net income was US$6.4 billion or US$8.38 per share diluted.
Its P/E ratio is 6.99, and the forward P/E for one year is 9.14. The dividend yield is 4.66%, with an annualized dividend of US$2.80.
Also Read: REITs with over 5.5% dividend yield to explore
Walgreens Boots Alliance, Inc. (NASDAQ:WBA)
Market Cap: US$42.9 billion
Closing price on January 28, 2022: US$50.46
One year return: 0.42%
The Illinois-based Walgreens Boots is a retail pharmacy chain. It has a presence in around 11 countries with more than 21,000 stores.
For the three months ended November 30, 2021, the company posted revenue of US$33.9 billion. The net earnings attributable to the company was US$3.58 billion or US$4.13 per share diluted.
Its P/E ratio is 6.7, and the forward P/E for one year is 9.97. The dividend yield is 3.79%, with an annualized dividend of US$1.91.
Also Read: Top 5G stocks to explore as US rolls out the service
The Travelers Companies, Inc. (NYSE:TRV)
Market Cap: US$39.8 billion
Closing price on January 28, 2022: US$166.82
One year return: 22.39%
The Travelers Companies Inc is a finance company that offers a wide range of financial products, including commercial and personal insurance. It distributes the insurance policies through brokers and independent agents. It is headquartered in New York.
For the fiscal year ended December 31, 2021, the company recorded revenue of US$34.8 billion and a net income of US$3.662 billion, up 36% YoY. The company booked a return on equity of 12.7%, and earnings per share diluted at US$13.94.
Its P/E ratio is 11.37, and the forward P/E for one year is 12.85. The dividend yield is 2.11%, with an annualized dividend of US$3.52.
Also Read: BitTorrent surges 9% as exchanges start accepting BTT token migration
Bottomline
The Dow Jones Industrial Average (DJIA) Index is popular among investors and analysts. They typically monitor the index to gauge the market's bull or bear phase. Initially, there were only 12 companies in the index, mainly from the industrial sector. Presently, it has the top 30 companies from diverse sectors, giving a broader representation of the economic sectors.
