

The US dollar index (DXY) continued its downtrend last week as the market reflected to the Federal Reserve decision, weak consumer confidence and flash manufacturing PMI data, and falling inflation. It slipped to a low of $100.4, down by over 5.7% from its highest point this year and 12.5% below the 2022 high.
Odds of more Fed cuts rise
The main catalyst for the US dollar index retreat was the decision by the Federal Reserve to start cutting interest rates this month.
In a meeting two weeks ago, officials decided to cut rates by 0.50%, higher than what most analysts were expecting. In subsequent statements, Fed officials like Neel Kashkari and Raphael Bostic supported more rate cuts.
However, some Fed officials have called for caution and recommended that it should cut rates more gradually. In an FT interview, Alberto Musalem argued that cutting rates more aggressively risked overheating financial conditions, a move that may stimulate inflation.
Economic numbers released last week showed that the Fed has room to delivering more cuts in the next two meetings of the year.
According to S&P Global, US manufacturing remained below 45 in September and has been in that level in the past few years. As such, there are signs that the sector has reacted mildly towards President Biden’s industrial policies.
Another report by the Conference Board showed that consumer confidence had its biggest drop in three years in September. The report revealed that many people were concerned about the rising unemployment rate in the country.
Most importantly, there are signs that inflation was dropping. A report by the Bureau of Economic Analysis showed that the personal consumption expenditure (PCE) retreated to 2.2%, a big drop than most analysts were expectnf.
The PCE is an important inflation gauge because, unlike the consumer price index (CPI), it looks at price changes in rural and urban centers. It is also the Fed’s preferred inflation gauge.
There are other signs that inflation will continue falling. For one, the price of crude oil has dropped, with Brent and West Texas Intermediate (WTI) falling to $71 and $68.6, respectively.
US NFP data ahead
The next important catalyst for the US dollar index will be the upcoming US nonfarm payrolls (NFP) data.
Economists expect the data to reveal that the country’s NFP came in at 144k in September, an improvement from the previous month’s 142k. The unemployment rate remained at 4.2% while the average hourly earnings rose to 3.4%.
These are crucial numbers because the Fed has shifted its focus from inflation to the labor market. As such, it hopes that these rate cuts will help to stimulate the economy, leading to more jobs, without stimulating inflation.
Other central banks actions
The US dollar index has also been affected by the actions of other central bank decisions in the past few weeks.
The Bank of England (BoE) decided to leave interest rates unchanged at 5% in the last meeting. Other notable banks like the European Central Bank, Bank of Canada, and Swiss National Bank have all slashed rates this month.
As a result, these currencies have strengthened significantly against the US dollar. The EUR/USD exchange rate rose to 1.1215, its highest point since July 19 last year.
Similarly, the GBP/USD pair has surged to 1.3427, its highest level since February 2022, and 29% above its lowest point in 2022.
The Swiss franc has tumbled to 0.8400, its lowest point since December last year and 17% below the year-to-date high.
The dollar has also slipped against other emerging market currencies like the South African rand, Chinese yuan, and the Indonesian rupiah.
US dollar index analysis
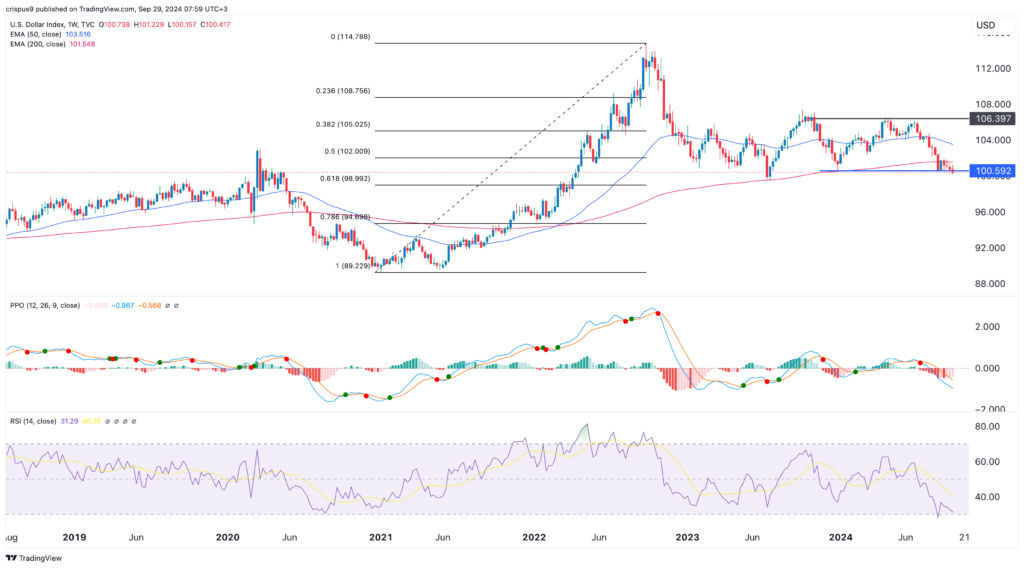
DXY chart by TradingView
The weekly chart shows that the DXY index formed a double-top chart pattern at $106.40. In most periods, this is one of the highly popular bearish patterns. It has now moved slightly below the double-top’s neckline at $100.60, its lowest swing in December last year. The US dollar index has also moved below the 50% Fibonacci Retracement level at $102.
It has also moved below the 50-week and 200-week Exponential Moving Averages (EMA) while the Percentage Price Oscillator (PPO) and the Relative Strength Index (RSI) have continued falling. Therefore, the US dollar will likely continue falling as sellers target the next key support at $989, the 61.8% retracement point.
The post US dollar index (DXY) analysis as focus shifts to NFP data appeared first on Invezz
