


Summary
- Kiwi dollar reached a 2-year high of USD 0.7040 on 27 November 2020 despite indication of a possible negative interest rate by the Reserve Bank.
- The economic recovery lifted consumer and business sentiments, and better Terms of Trade seem to be helping the currency.
- Why USD 0.7000 is the key resistance level to watch?
Kiwi dollar once again reclaimed the USD 0.7000 mark after the currency climbed the price ladder swiftly to trade at USD 0.7040 (intraday high on 27 November 2020) in two years. The jump in the domestic currency has been primarily led by a recovery in economic activities, leading to high business and consumer confidence. Apart from that, a gradual recovery in NZ Terms of Trade has propelled market sentiments.
The economic activities on the domestic level recovered during the third quarter of the year 2020 while setting upbeat conditions for the fourth quarter.
During the September 2020 quarter, the electronic card transactions rose notably which along with a significant recovery in consumer confidence hinted towards stronger household spending. Likewise, business sentiments on the domestic front improved in October 2020.
Jacinda Ardern Appoints a New Cabinet for Economic Growth
Meanwhile, the second time elected Prime Minister Jacinda Ardern named a new cabinet to focus on economic recovery, and the new government announced that it would extend support for small business in the face of loan schemes while boosting funding for the Flexi-wage job support program.
Apart from that, many industry experts anticipate that economic activities should once again surge in 2021 amid hightened investment activities and private consumption, bolstered by expansionary fiscal and monetary policies.
The Reserve Bank Easing Money Supply, Spurring Prospect of Economic Growth
The Reserve Bank recently decided to keep the official cash rate unchanged at the historic low of 0.25 per cent while ramping up the monetary stimulus program. However, the central monetary authority also hinted that it could bring the OCR to negative zone to lower borrowing costs, which at present, is keeping a lid on NZD.
Furthermore, the Reserve Bank agreed to keep the money flow intact through various lending Programmes, commencing in December 2020.The prospect of the economy recovery presently seems to be boding well with market sentiments, lifting the dollar to a 2-year high.
Consumer Confidence at Eight-Month High
In October 2020, the ANZ-Roy Morgan Consumer Confidence Index soared to 108.7 against the threshold level of 100.0, reflecting that the current financial situation across households improved considerably.
NZ Terms of Trade Rebounds to a 3-year High
The terms of trade that measures the purchasing power of export surged by 2.5 per cent during the June 2020 quarter, reaching a 3-year high of 1,528.00 points over strong forestry and dairy product prices. The merchandise terms of trade exceeded the market expectation of just a 0.9 per cent increase while improving significantly against the 0.6 per cent decline witnessed in the previous quarter.
Therefore, despite an indication by the Reserve Bank on the possibility of shifting the OCR down to the negative territory, the currency seems to be deriving value from a boost in economic activities. Furthermore, market sentiments around the domestic dollar seem to be blending well with the consumer and business sentiments, which is now more than indemnifying the impact of lower interest rates.
Gold Depreciation Further Confirming the Kiwi Dollar Strength
The recovery in economic activities across the domestic front with a perspective of a sustainable recovery in 2021 is strengthening the Kiwi dollar. Furthermore, the gold value quoted in NZD is showing a deprecation over a recovery in economic growth, which is further confirming the strength gained by the domestic currency.
Gold spot (quoted in NZD) fell from the level of NZD 3,108.85 (intraday high on 6 August 2020) to the present low of 2,580.16 (as on 25 November 2020 (7:27 PM Wellington time), marking a price depreciation of ~ 17.00 per cent.
NZD/USD on Charts
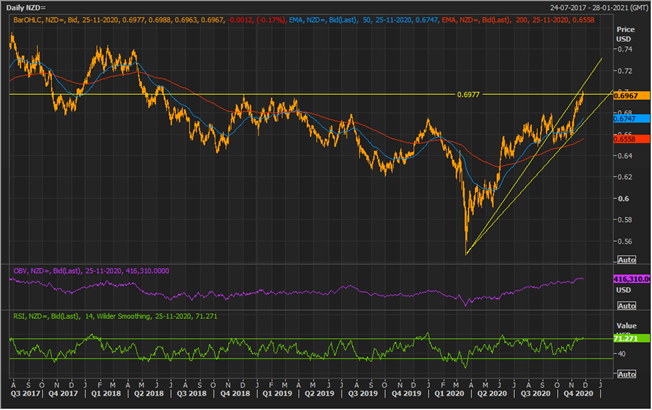
NZD/USD Daily Chart (Source: EODHD/Others Eikon, Thomson Reuters)
On following the daily chart of the currency pair with USD, it could be seen that the currency has now gained an uptrend with prices trading above the 200-day and 50-day exponential moving averages. Also, both exponential moving averages are showing a positive cross, which is further reflecting on the prevailing bullish sentiments.
However, at present, NZD is hovering over the long-term horizontal resistance line or the resistance level of ~ $0.7000. Also, while the currency is testing gaining strength, the 14-day relative strength index (RSI) is also testing its previous peak.
Also, if the currency corrects below the $0.7000 mark, it could take a short-term correction as indicated by the RSI overbought level of 71. However, such a correction is usually not considered as a trend reversal as the volume indicator (OBV), and the price & volume indicator (RSI) are reflecting large bullish participation.
Furthermore, the support level of $0.7000 is the key level to monitor as the recent price rally terminated around the extension of the accelerated trendline, which is overlapping with the horizontal line, suggesting that the current support is a decisive point.
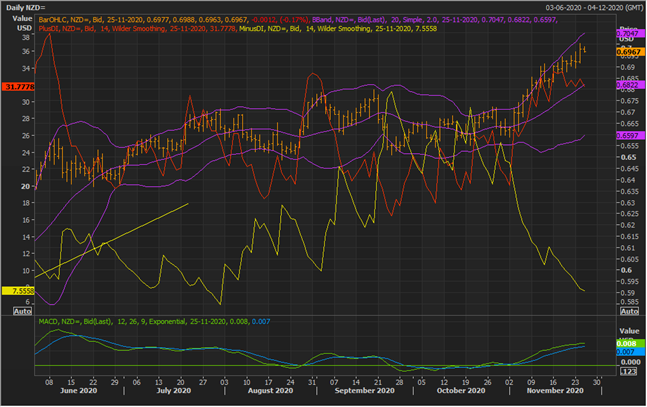
NZD/USD Daily Chart (Source: EODHD/Others Eikon, Thomson Reuters)
On further zooming into the recent price action, it could be seen that the currency is currently trading around the +2 Standard Deviation of the 20-day simple Bollinger Band® without a volatility breakout. Also, the +2 Standard Deviation of 20-day simple Bollinger band is falling around the USD 0.7000 mark, confirming the support level once again.
A break and sustain above USD 0.7000 might also lead to a volatility breakout, which holds the ability to seed bullish sentiments over the medium-term.
At present, the currency is trading above the + DI, reflecting strong bullish sentiments, and the pair of plus DI and minus DI are showing a positive cross with a large spread, confirming the strength of the current bullish rally.
Also, the 12,26,9 MACD is showing a positive cross with the signal line crossing the base line from below while distancing apart, confirming the upside gush.
