
 AUS
AUS
 NZ
NZ
 UK
UK
 CA
CA
 USA
USA
 IND
IND







Summary
- Silver has been under an impeccable and unabated rally with spot prices reaching to a seven-year high of USD 26.201 per ounce on 28 July 2020.
- The rally in silver is not lagging behind gold, which in the status quo, has emerged as a stallion to climb to a record high of USD 1,981.13 per ounce.
- The rally in silver is supported by demand for physical investment, which as per the Silver Institute would grow by 16 per cent in 2020.
- While fundamentals behind the silver rally look to be well-cemented, the commodity is showing some interesting developments on charts as well.
Silver has been under an unabated rally with silver spot flexing some muscles and reaching to a seven-year high of USD 26.201 per ounce (as on 28 July 2020 5:51 PM AEST) while the other precious metal- gold is contouring a record high of USD 1,981.13 (as on 28 July 2020 6:00 PM AEST).
The rally in silver is supported by demand for physical investment, which as per the Silver Institute would grow by 16 per cent in 2020.
To Know More, Do Read: Silver Outperforms Gold with Over 30% Return; Money Managers Betting on Silver!!
While fundamentals behind the silver rally look to be well-cemented, the commodity is showing some interesting developments on charts as well.
To Know More, Do Read: Silver to Reach USD 19.0 Per Ounce by Year-End- Says The Silver Institute
Silver on Charts
XAGUSD (or Silver Spot) Daily Chart (Source: EODHD/Others Eikon Thomson Reuters)
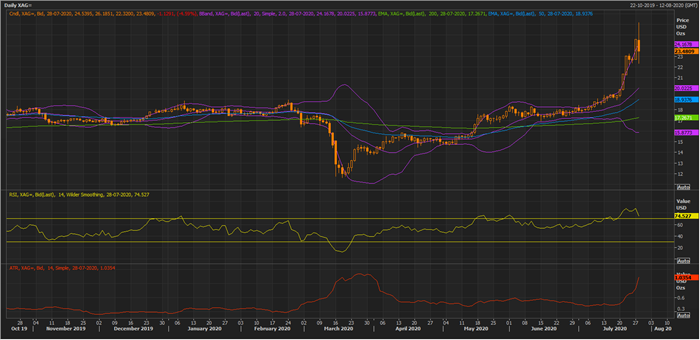
On the daily chart, it could be seen that silver demonstrated a steep rally in the recently with prices climbing above the 200-day exponential moving average and 50-day exponential moving average (or EMA), reflecting on strong bullish sentiments in the commodity.
- Furthermore, silver even presented a volatility breakout on 28 July 2020 with prices breaching the +2 Standard Deviation (or SD) of the 20-day simple Bollinger band; however, failed to sustain and the commodity quickly retracted over half of the intraday gain to close below the +2 SD.
- The 14-day Average True Range spiked in tandem with the price; however, the 14-day Relative Strength Index is now sloping downward after reaching the overbought zone.
- On overlaying the observation from the +2 SD of the Bollinger band and the 14-day RSI, it could be assessed that some profit booking activities took place recently.
XAGUSD (or Silver Spot) Daily Chart (Source: EODHD/Others Eikon Thomson Reuters)
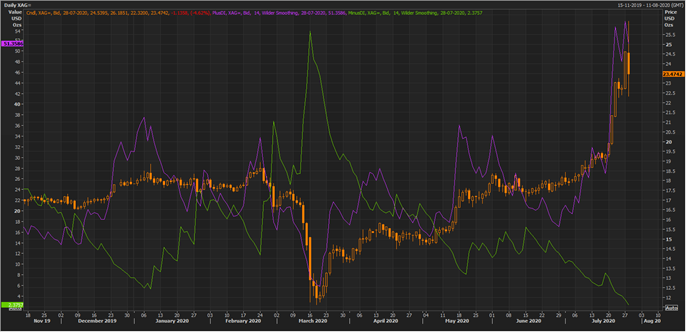
- On applying the pair of directional signals, it could be seen that the plus directional index (or DI) is trading above the minus DI with a large spread, suggesting that prevailing sentiments are bullish in nature.
- Also, the plus DI had previously crossed the minus DI from below, reflecting on bulls strength.
XAGUSD (or Silver Spot) Daily Chart (Source: EODHD/Others Eikon Thomson Reuters)
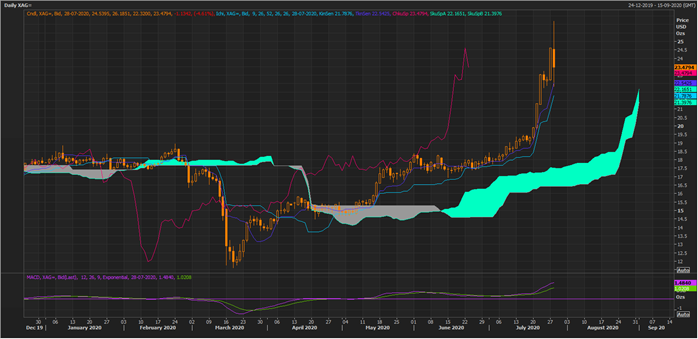
On applying the Ichimoku clouding technique on the daily chart, it could be seen that silver is currently trading above Span A of the Ichimoku or say trading above the mean value of the conversion line and the base line.
- The conversion line or the mean value of 9-day highs and lows is currently trading above the base line or the mean value of 26-day highs and lows, suggesting that the short-term trend is positive in silver.
- Furthermore, as Span A is also trading above Span B, which is the mean value of 52-day highs and lows, it could be said that the medium-term trend is also positive in nature.
- The conversion line crossed the base line from below and above Span A, reflecting on strong bullish sentiments.
- The sky blue cloud area could now act as immediate support for silver, while the recent high could act as short-term resistance.
- The 12,24,9 MACD indicator is also showing a positive signal with the signal line crossing the MACD line from below, which could further seed bullish sentiments.
Gold-to-Silver Ratio
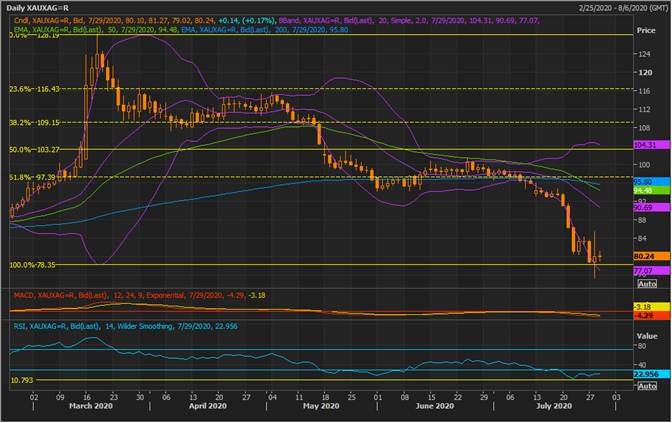
The gold-to-silver ratio or properly known as XAUXAG fell drastically in the recent times over the rally in silver prices. However, the ratio now seems to have retracted 100.0 per cent of its previous rally, which could suggest silver bulls are having upper hand over gold bulls.
Silver Spot Daily Chart (Source: EODHD/Others Eikon Thomson Reuters)
On following the XAUXAG on a daily chart, it could be seen that the ratio has now retraced 100.0 per cent of the previous rally and post breaching the 100.0 per cent level, the ratio rose slightly (gap up on the hourly chart).
- At present, the ratio is currently trading below the 200-day EMA and 50-day EMA, reflecting on the strong performance from gold as compared to silver; however, the ratio has now taken the support of -2 SD of the 20-day simple Bollinger band.
- Also, the 14-day RSI is rebounding from its historical support line, reflecting that the ratio is now recovering from the overbought zone, which in turn, could attract bulls to silver is the rally in bullions continues.
- However, the 12,24,9 MACD is showing a negative cross as the ratio is yet facing considerable resistance.
- The primary resistance for the ratio is at the mean value of the Bollinger band, which would also be decisive in nature as the mean value of the Bollinger, 200-day EMA, and 50-day EMA are overlapping around the same level.
- On the support counter, the recent low of the ratio along with -2 SD of the Bollinger band could act as immediate support.
