


Silver prices are again gaining traction on the global front with spot prices recovering from its recent low of USD 11.640 per ounce (intraday low on 18 March 2020) to the present high of USD 15.860 per ounce (intraday high of 14 April 2020), which marked a price appreciation of ~36.25 per cent.
Presently silver spot is hovering around the recent peak of USD 15.860 and is currently trading at USD 15.489 per ounce (as on 8 May 2020 5:10 PM AEST).
In the status quo, while gold prices are showing early indication of a possible correction ahead, silver is gaining further momentum, and gold-to-silver ratio or XAUXAG is showing bearish signals, suggesting that now silver could outperform gold.
To Know More, Do Read: Gold- Is a Reversal on the Cards as Central Banks Go Slow on Buying?
While silver and gold show some degree of correlation, the recent rally in silver makes much sense with demand for PV cells growing across the globe, and global economy, especially China is showing decent signs of recovery.
To Know More, Do Read: Rooftop Solar PVs Dodge the COVID-19 Impact as New Installations Set Records
Performance Graph
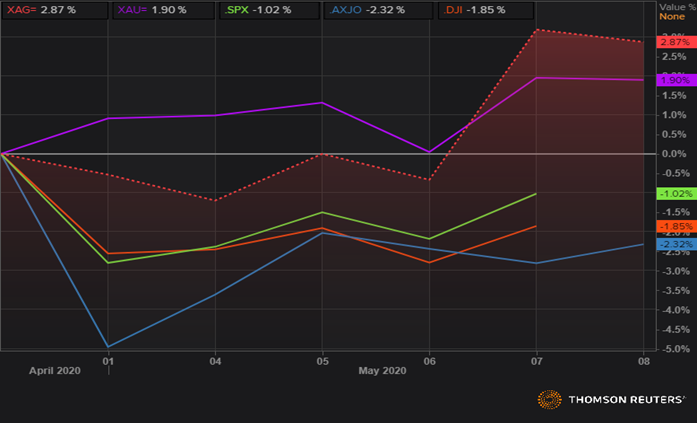
Source: (EODHD/Others Thomson Reuters)
In the status quo, silver delivered a return of 2.87 per cent on the MTD-basis to outperform gold and major equity indices. Also, the Dow Jones Industrial Average is now showing a slightly better performance, which in turn, might have supported silver prices as well.
The XAUXAG Ratio
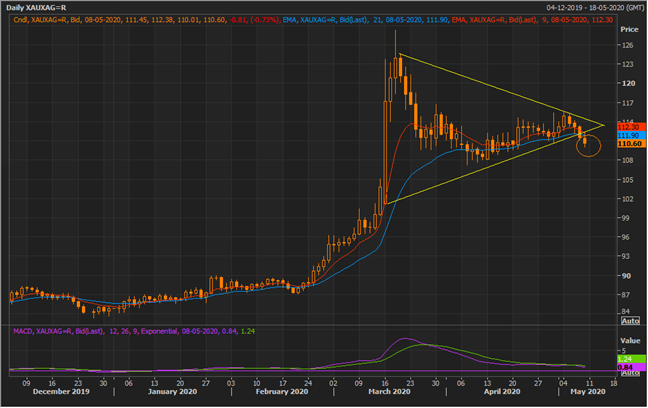
XAUXAG Daily Chart (Source: EODHD/Others Thomson Reuters)
On following the XAUXAG ratio on a daily timeframe it could be seen that the ratio has breakdown out of a symmetrical triangle pattern, which is a bearish signal for gold, but a positive signal for silver. The 12,26,9 MACD is also showing a negative signal, while the spread between the 9-day exponential moving average and the 21-day exponential moving average is narrowing, reflecting bearish sentiment around gold and bullish sentiments around silver.
It could be inferred from the above chart pattern and the recent price behaviour of the ratio, that silver might outperform gold ahead.
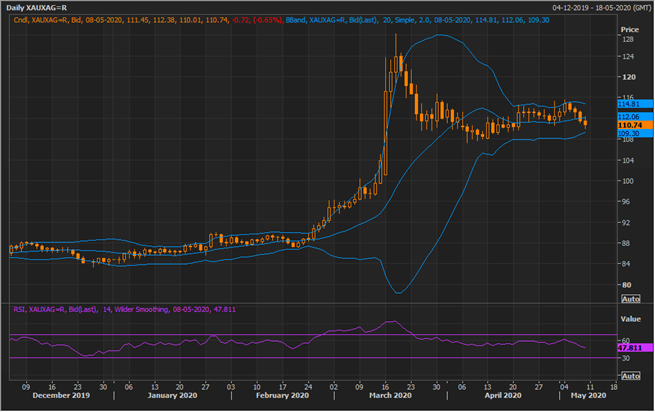
XAUXAG Daily Chart (Source: EODHD/Others Thomson Reuters)
On further following the same timeframe and post applying the Bollinger Band, it could be seen that the ratio is now trading below the mean value of 20-day trading prices and it is now moving to test the -1 standard deviation of the band.
Also, the Bollinger Band is now squeezing, and investors should monitor if the band would show an expansion in +-1 standard deviation, and if that happens, it would further confirm the possibility of a better performance in silver as compared to the gold spot ahead.
Silver Fundamentals
Against the backdrop of the recent plunge in global equity indices and higher liquidation seen due to the fall in global financials in the wake of COVID-19 outbreak, one might expect silver to perform well amid its correlation with gold, and safe haven attributes. However, due to the weak industrial demand silver has also taken a considerable hit with spot dropping from the peak of USD 18.963 per ounce (intraday high on 24 February 2020) to the level of USD 11.640 per ounce, which marked a drop of ~ 38.61 per cent.
However, now with the slight improvement in the global economy and restoring industrial demand, silver is again gaining traction in the market.
- Demand and Supply Dynamics
On the supply counter, the Silver Institute anticipates a 5 per cent fall in global mine production for 2020 and an overall decline of 4 per cent in the total global supply. The global mine production which took a hit for the fourth consecutive year in 2019, dropping by 1.3 per cent on a year-on-year basis to stand at 836.5 million ounces, is now anticipated to stand at 797.8 million ounces.
The production fall is largely estimated to occur due to declining grades at several large primary silver mines, lower silver production from copper mines and notable disruption losses at some major silver producers.
The 2019 silver production took a hit from a decline in production of 3.8 per cent (y-o-y) from primary silver mines, classified as a mine where silver is the main revenue source over the life-of mine. The production also took a toll from a decline in production as a by-product of copper mining, which marked a decline of 3.1 per cent on a yearly basis to stand at 190.6 million ounces during 2019.
Furthermore, the Silver Institute anticipates that the net hedging supply would mark a decline of 36 per cent to stand at 10.0 million ounces in 2020 as compared to its previous level of 15.7 ounces.
On the demand counter, the global demand is expected to mark a decline of 3 per cent as compared to a slight increase of 0.4 per cent in 2019 to stand at 963.4 million ounces.
The demand for silver which remained high in the PV industry, marking a gain of 7 per cent on a yearly basis in 2019 to stand at 98.7 per cent, is anticipated to witness a fall of 3 per cent this year amid a slowdown in GDP growth across the globe.
However, the demand for net physical silver for investment purpose is projected by the Silver Institute to mark an increase of 16 per cent to stand at 215.8 million ounces to register a gain for the fourth consecutive year.
The snippet of the demand and supply forecast presented by the Silver Institute is as below:
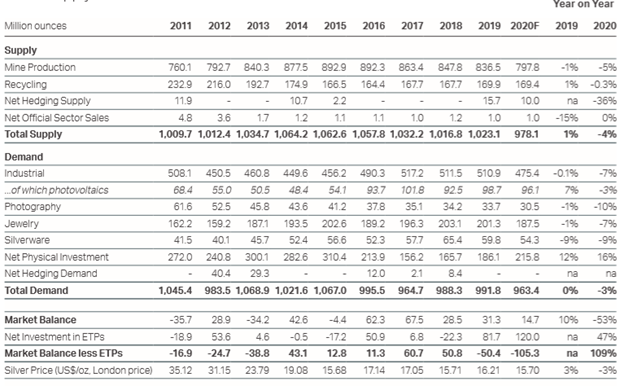
Source: World Silver Survey Report (The Silver Institute)
The Price Forecast
The Silver Institute anticipates that the market would mark another year of supply surplus; however, it would be 53 per cent lower against the previous surplus in 2019. The group further projects that it would be another year of strong inflows into silver exchange-traded products and suggests that silver would outperform gold ahead.
On the price counter, the institute anticipates the silver price to reach USD 19.0 per ounce by the year-end; however, projects the full average to fall by 3 per cent on a yearly basis to stand at USD 15.70 per ounce.
