


Highlights
- Link Administration (ASX:LNK) offers loan and asset management services, retirement and superannuation solutions, fund administration and transfer agency services
- LNK expects its operating EBIT in FY23 to surpass the upper end of the 10-12% guidance range
- LNK shares have dropped by nearly 21% in the past 12 months
Link Administration Holdings Limited (ASX:LNK) provides technology-enabled solutions for data administration to companies, large asset owners, and trustees worldwide. The company offers loan and asset management services, retirement and superannuation solutions, fund administration and transfer agency services and comprehensive corporate market offerings in global equity markets.
On Wednesday, 19 July 2023, LNK shares closed 0.940% lower at AUD 1.580 apiece. In the last significant update on 30 June, LNK reaffirmed its guidance shared during the first half of the financial year 2023 (1HFY23). Now, the company expects its operating EBIT to be slightly above the upper end of the 10-12% guidance range. However, the company mentioned that its contract for the provision of fund administration services would not be renewed with HESTA.
The market probably did not take this positively; LNK shares closed nearly 14% lower at AUD 1.670 on 30 June. Between 30 June to 19 July 2023, the stock fell another 6%. Including today’s losses, the stock has already corrected over 19%.
In the past three months, the share price has tumbled by 24.40% and in the last 12 months, it has dropped nearly 21%. Will there be a reversal in the stock soon? Let's study the price chart of LNK to get clues about the near-term direction of the stock.
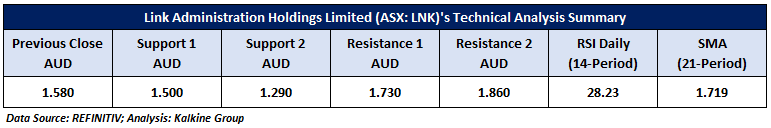
LNK’s Technical Analysis:
LNK’s prices are currently trading around the crucial support level of AUD 1.54, indicating the possibility of an upside reversal. In addition, the RSI (14-period) is also entered the oversold region, supporting the possibility of an upside movement hereon. However, the trend following indicators 21-period SMA and 50-period SMA are above the current market prices and may serve as the dynamic resistance levels for the stock. Important support for the stock is positioned at AUD 1.290, while key resistance is located at AUD 1.860.
Daily Technical Chart – LNK
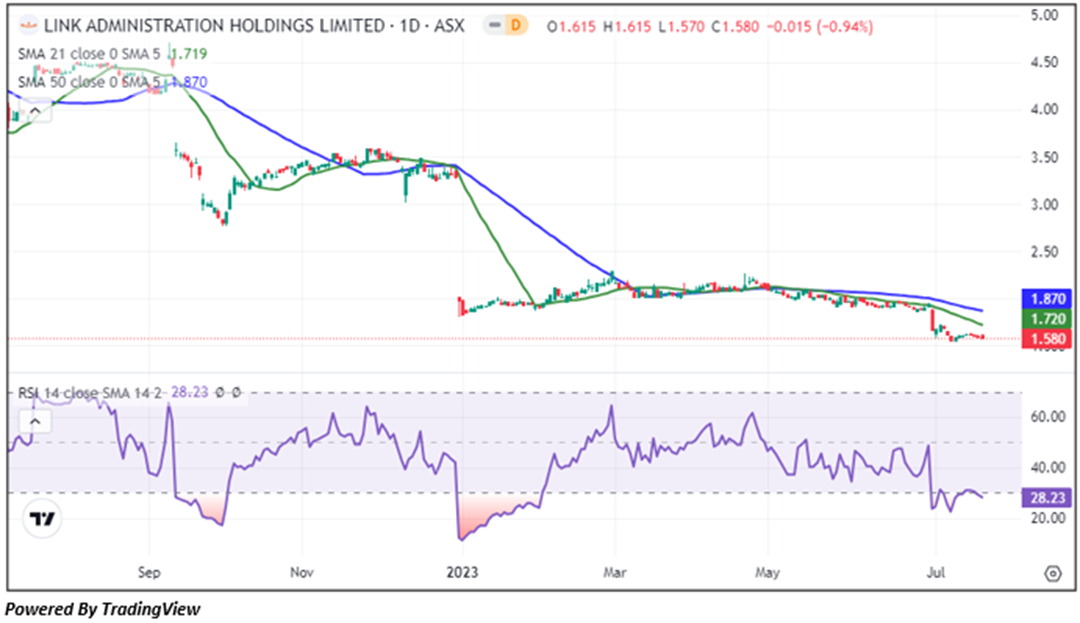
The stock was analysed as per the closing price of AUD 1.580 per share, down by 0.94% as on 19 Jul 2023.
Note 1: Past performance is neither an Indicator nor a guarantee of future performance.
Technical Indicators Defined:
Support: A level at which the stock prices tend to find support if they are falling, and a downtrend may take a pause backed by demand or buying interest. Support 1 refers to the nearby support level for the stock, and if the price breaches the level, then Support 2 may act as the crucial support level for the stock.
Resistance: A level at which the stock prices tend to find resistance when they are rising, and an uptrend may take a pause due to profit booking or selling interest. Resistance 1 refers to the nearby resistance level for the stock and if the price surpasses the level, then Resistance 2 may act as the crucial resistance level for the stock.
Stop-loss: It is a level to protect further losses in case of unfavourable movement in the stock prices.
The Green colour line reflects the 21-period moving average. SMA helps to identify existing price trends. If the prices are trading above the 21-period, prices are currently in a bullish trend (Vice – Versa).
The Blue colour line reflects the 50-period moving average. SMA helps to identify existing price trends. If the prices are trading above the 50-period, prices are currently in a bullish trend (Vice – Versa).
The Orange/ Yellow colour line represents the Trendline.
The Purple colour line in the chart’s lower segment reflects the Relative Strength Index (14-Period), which indicates price momentum and signals momentum in trend. A reading of 70 or above suggests overbought status, while a reading of 30 or below suggests an oversold status.
Disclaimer
This article has been prepared by Kalkine Media, echoed on the website kalkinemedia.com/au and associated pages, based on the information obtained and collated from the subscription reports prepared by Kalkine Pty. Ltd. [ABN 34 154 808 312; AFSL no. 425376] on Kalkine.com.au (and associated pages). The principal purpose of the content is to provide factual information only for educational purposes. None of the content in this article, including any news, quotes, information, data, text, reports, ratings, opinions, images, photos, graphics, graphs, charts, animations, and video is or is intended to be, advisory in nature. The content does not contain or imply any recommendation or opinion intended to influence your financial decisions, including but not limited to, in respect of any particular security, transaction, or investment strategy, and must not be relied upon by you as such. The content is provided without any express or implied warranties of any kind. Kalkine Media, and its related bodies corporate, agents, and employees (Kalkine Group) cannot and do not warrant the accuracy, completeness, timeliness, merchantability, or fitness for a particular purpose of the content or the website, and to the extent permitted by law, Kalkine Group hereby disclaims any and all such express or implied warranties. Kalkine Group shall NOT be held liable for any investment or trading losses you may incur by using the information shared on our website.
