


Highlights
- JDO’s H1FY25 gross loans and advances (GLA) rose 9% YoY to AUD 11.65 billion from AUD 10.71 billion in H1FY24.
- AMP Limited became a substantial holder of JDO with 5.06% voting power.
- JDO maintains 15% FY25 profit growth target and expects 50% YoY growth in FY26.
Judo Capital Holdings Limited (ASX:JDO) is an ASX-listed financial company that provides banking products and services to small and medium-sized businesses in Australia.
In the first half of the financial year (H1FY25), the company’s income increased by 2% YoY to AUD 200.9 million. Gross loans and advances (GLA) rose by 9% YoY to AUD 11.65 billion in H1FY25, up from AUD 10.71 billion in H1FY24. Meanwhile, statutory net profit after tax NPAT grew by 70% YoY to AUD 40.9 million, compared to AUD 24 million in the prior corresponding period. However, the net interest margin (NIM) declined by 4 basis points to 2.81%, compared to 2.85% in H2FY24.
In the third quarter of FY25 (Q3FY25), GLA of JDO reached AUD 11.7 billion and NIM was within the range of 2.90-3.0% for H2FY25.
Recent Business Update
JDO announced on 20 June 2025 that AMP Limited had become a substantial holder in the company with 5.06% voting power.
Company Outlook
JDO expects its gross loans and advances (GLA) to range between AUD 12.4–12.6 billion by 30 June 2025. The guidance has been lowered from prior guidance due to market uncertainty and slower warehouse lending. The company targets a net interest margin (NIM) of around 3% for H2FY25 and aims to reduce its FY25 cost-to-income ratio (CTI) compared to FY24.
JDO maintains its FY25 pre-tax profit growth target of 15% and aims for 50% YoY growth in FY26.
Share performance of JDO
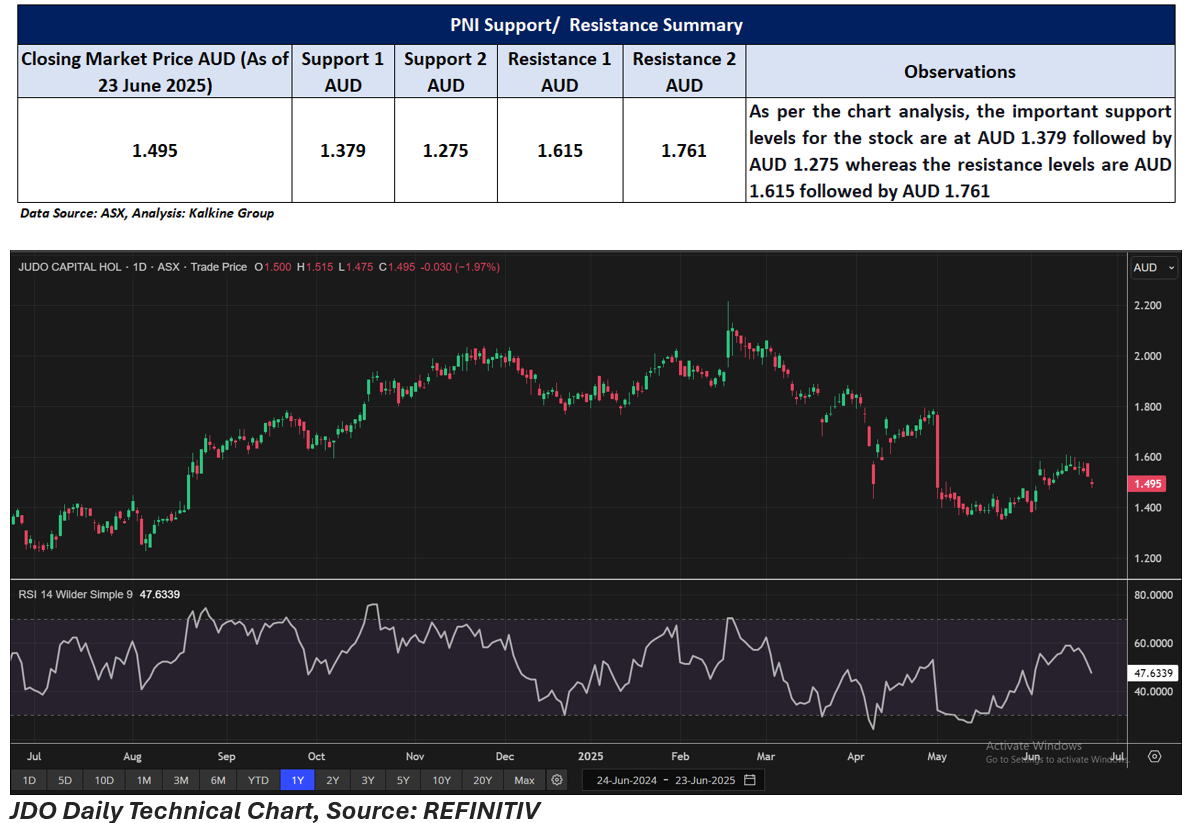
JDO shares closed 1.97% lower at AUD 1.495 per share on 23 Jund 2025. Over the past year, the stock has gained 12.41%, although it is down 15.54% in the past three months and 18.31% over six months. Year-to-date, the share price has fallen by 17.86%.
The 52-week high for JDO is AUD 2.215, recorded on 18 February 2025, while the 52-week low is AUD 1.225, recorded on 3 July 2024.
Support and Resistance Summary
Note 1: Past performance is neither an Indicator nor a guarantee of future performance.
Note 2: The reference date for all price data, and currency, is 23 June 2025. The reference data in this report has been partly sourced from EODHD/Others.
Technical Indicators Defined:
Support: A level at which the stock prices tend to find support if they are falling, and a downtrend may take a pause backed by demand or buying interest. Support 1 refers to the nearby support level for the stock and if the price breaches the level, then Support 2 may act as the crucial support level for the stock.
Resistance: A level at which the stock prices tend to find resistance when they are rising, and an uptrend may take a pause due to profit booking or selling interest. Resistance 1 refers to the nearby resistance level for the stock and if the price surpasses the level, then Resistance 2 may act as the crucial resistance level for the stock.
Disclaimer
This article has been prepared by Kalkine Media, echoed on the website kalkinemedia.com/au and associated pages, based on the information obtained and collated from the subscription reports prepared by Kalkine Pty. Ltd. [ABN 34 154 808 312; AFSL no. 425376] on Kalkine.com.au (and associated pages). The principal purpose of the content is to provide factual information only for educational purposes. None of the content in this article, including any news, quotes, information, data, text, reports, ratings, opinions, images, photos, graphics, graphs, charts, animations, and video is or is intended to be, advisory in nature. The content does not contain or imply any recommendation or opinion intended to influence your financial decisions, including but not limited to, in respect of any particular security, transaction, or investment strategy, and must not be relied upon by you as such. The content is provided without any express or implied warranties of any kind. Kalkine Media, and its related bodies corporate, agents, and employees (Kalkine Group) cannot and do not warrant the accuracy, completeness, timeliness, merchantability, or fitness for a particular purpose of the content or the website, and to the extent permitted by law, Kalkine Group hereby disclaims any and all such express or implied warranties. Kalkine Group shall NOT be held liable for any investment or trading losses you may incur by using the information shared on our website.
