


Highlights
- VAU’s revenue surged 139% YoY in H1FY25 to AUD 678.8 million, driven by higher production, higher gold prices, and effective cost controls.
- Gold sales rose 86% YoY to 199,428 ounces in H1FY25, while EBITDA increased by 179% YoY to AUD 267.4 million, with a robust margin of 39%.
- VAU narrows FY25 gold sales guidance to 390,000–410,000 ounces at AISC of AUD 2,250–2,450/oz, backed by H1 investments at Leonora and Mount Monger.
Vital Metals Limited (ASX:VAU) is a rare earths exploration and development company with a focus on gold and gold/copper concentrate in Canada and Australia. The company is underpinned by a long-life asset in the Leonora district.
In the first half of the financial year (H1FY25), gold sales rose by 86% year-on-year (YoY) to 199,428 ounces. In H1FY25, the company generated revenue of AUD 678.8 million, up 139% YoY, on the back of increased average realised prices, higher gold production and disciplined cost management. EBITDA for the period increased by 179% YoY to AUD 267.4 million, with an EBITDA margin of 39%.
During the reported period, net profit after tax grew by 311% YoY to AUD 119.3 million.
During the March 2025 quarter, the company reported gold output of 87,110 ounces and sold 89,827 ounces at an average realised price of AUD 3,812 per ounce, with an all-in sustaining cost (AISC) of AUD 2,553 per ounce. Year-to-date output reached 282,526oz with sales averaging at AUD 3,506 per ounce and AISC at AUD 2,344 per ounce.
Business Update
Through an ASX update dated 26 May, the company announced an update to its Leonora site, increasing King of the Hills (KoTH) open pit reserve to 2.2-million-ounce, an uplift of 33%. Furthermore, the company expects AUD 92 million Stage 2 plant upgrade to increase capacity to 7.5mtpa. The upgrade is expected to improve recovery rates and reduce unit costs, enhancing long-term profitability at the King of the Hills site.
Company Outlook
VAU continues to project FY25 gold sales between 390,000 and 410,000 ounces, with AISC expected in the range of AUD 2,250 to 2,450 per ounce. This outlook is supported by anticipated production gains in Q4 from Mount Monger and Leonora operations.
Drilling activities at KoTH and Darlot are focused on increasing underground resource volumes and upgrading Inferred resources to Indicated.
Share performance of VAU
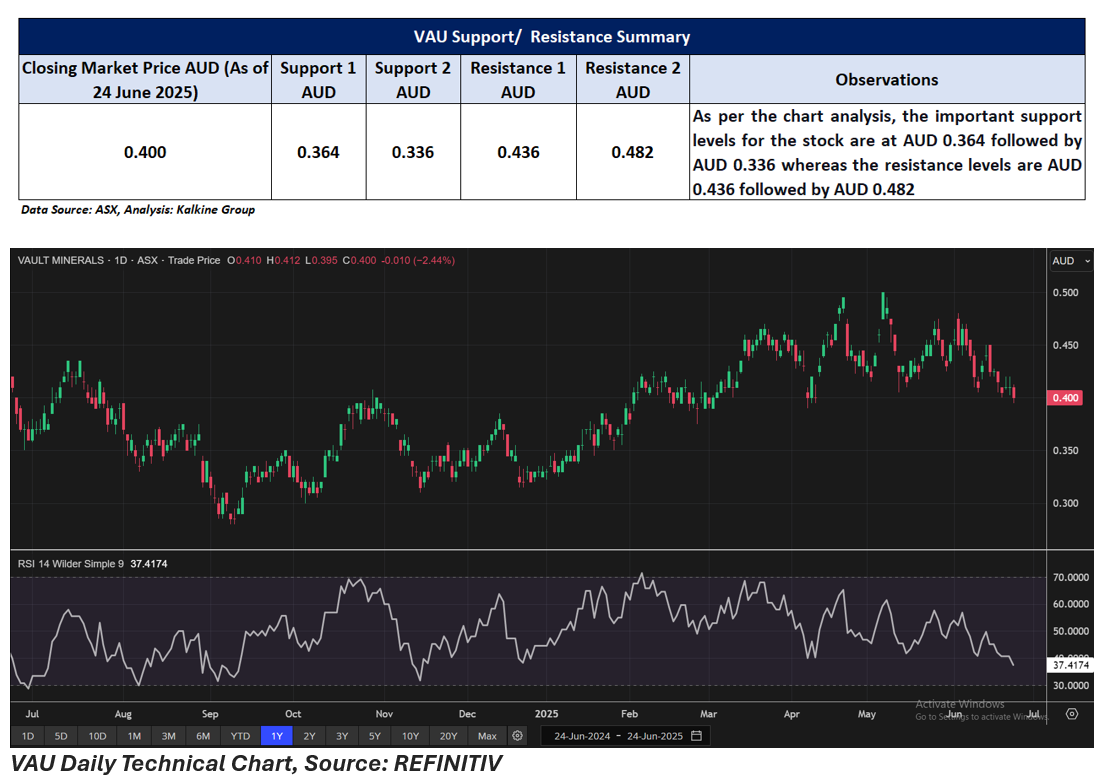
VAU shares closed 2.44% lower at AUD 0.400 on 24 June 2025. Despite the intraday dip, the stock has posted a 25.00% gain over the last six months and a 21.21% increase over the past nine months. However, it is down 5.88% in the past week and 11.11% over both the one- and three-month periods.
The 52-week high for VAU is AUD 0.500, hit on 7 May 2025, while the 52-week low is AUD 0.280, recorded on 10 September 2024.
Support and Resistance Summary
Note 1: Past performance is neither an Indicator nor a guarantee of future performance.
Note 2: The reference date for all price data, and currency, is 24 June 2025. The reference data in this report has been partly sourced from EODHD/Others.
Technical Indicators Defined:
Support: A level at which the stock prices tend to find support if they are falling, and a downtrend may take a pause backed by demand or buying interest. Support 1 refers to the nearby support level for the stock and if the price breaches the level, then Support 2 may act as the crucial support level for the stock.
Resistance: A level at which the stock prices tend to find resistance when they are rising, and an uptrend may take a pause due to profit booking or selling interest. Resistance 1 refers to the nearby resistance level for the stock and if the price surpasses the level, then Resistance 2 may act as the crucial resistance level for the stock.
Disclaimer
This article has been prepared by Kalkine Media, echoed on the website kalkinemedia.com/au and associated pages, based on the information obtained and collated from the subscription reports prepared by Kalkine Pty. Ltd. [ABN 34 154 808 312; AFSL no. 425376] on Kalkine.com.au (and associated pages). The principal purpose of the content is to provide factual information only for educational purposes. None of the content in this article, including any news, quotes, information, data, text, reports, ratings, opinions, images, photos, graphics, graphs, charts, animations, and video is or is intended to be, advisory in nature. The content does not contain or imply any recommendation or opinion intended to influence your financial decisions, including but not limited to, in respect of any particular security, transaction, or investment strategy, and must not be relied upon by you as such. The content is provided without any express or implied warranties of any kind. Kalkine Media, and its related bodies corporate, agents, and employees (Kalkine Group) cannot and do not warrant the accuracy, completeness, timeliness, merchantability, or fitness for a particular purpose of the content or the website, and to the extent permitted by law, Kalkine Group hereby disclaims any and all such express or implied warranties. Kalkine Group shall NOT be held liable for any investment or trading losses you may incur by using the information shared on our website.
