


Highlights
- Unlike mutual funds, ETFs trade throughout the day, reflecting real-time asset values.
- AAM S&P 500 High Dividend Value ETF targets major US companies with dividend yields.
- Invesco S&P 500 Momentum ETF delivered an impressive 54.41% return over the past year (as of August 31, 2024).
- The Roundhill Magnificent Seven ETF provides equal-weight investment in seven major technology companies.
Exchange-traded funds (ETFs) build on the advantages of mutual fund investing by offering flexible trading, lower operating costs, and greater transparency.
While traditional open-end mutual funds trade only once daily after market close, ETFs can be traded throughout the day at fluctuating prices. This continuous pricing reflects the real-time value of the underlying assets, allowing investors to know instantly how much they paid for shares and the proceeds from sales. For those seeking flexibility, ETFs offer a dynamic alternative to conventional mutual funds.
Here are our ETFs from the US equity market that have delivered over 15% returns in the past year.
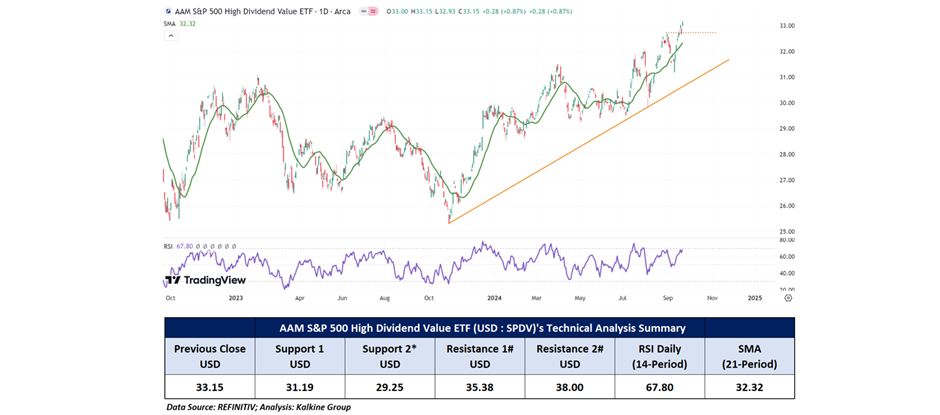
AAM S&P 500 High Dividend Value ETF (SPDV)
The fund aims to replicate the total return performance of the S&P 500 Dividend and Free Cash Flow Yield Index. It allocates a minimum of 80% of its total assets to securities within the Index, which includes ~500 prominent US-listed companies representing approximately 80% of the US equity market capitalisation.
As of August 31, 2024, the fund’s highest allocation is in financials (18.46%) followed by consumer cyclicals (14.66%). Its top three holdings include 3M Co-Ord, Stanley Black and Decker Inc. Ord, and Vistara Corp Ord.
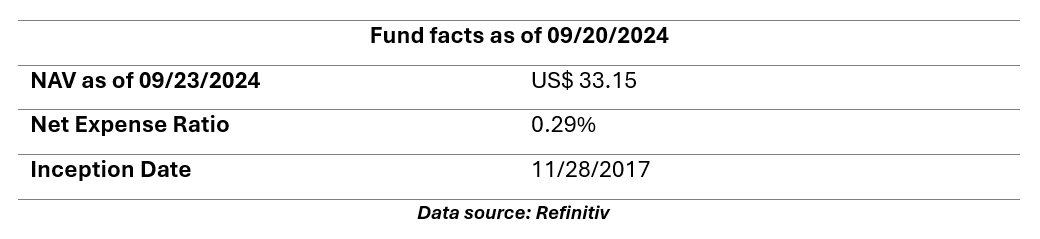
As of September 20, 2024, the fund has provided a return of 19.18% in the past year and 11.45% on a year-to-date basis.
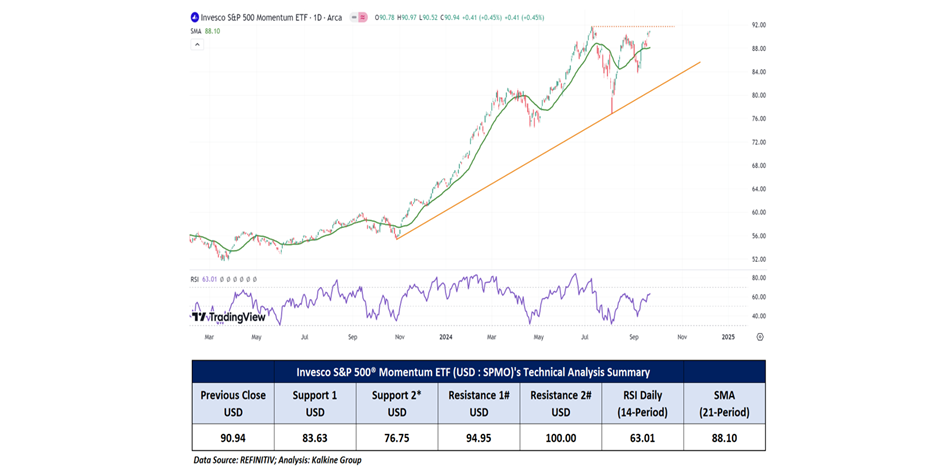
Invesco S&P 500® Momentum ETF (SPMO)
The Invesco S&P 500® Momentum ETF is designed to track the S&P 500 Momentum Index. The fund typically invests a minimum of 90% of its total assets in securities included in the index, which measures the performance of S&P 500® Index stocks with high "momentum scores."
As of September 23, 2024, the fund's largest allocation is in financials at 23.49%, followed by information technology at 20.37% and consumer discretionary at 12.52%. The top three holdings are Amazon.com Inc., NVIDIA Corp., and Eli Lilly & Co.
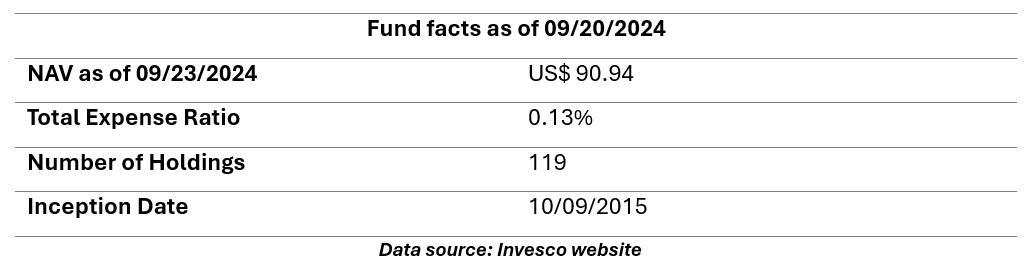
As of August 31, 2024, the fund has provided a return of 36.50% on a year-to-date basis and 54.41% over the past year.
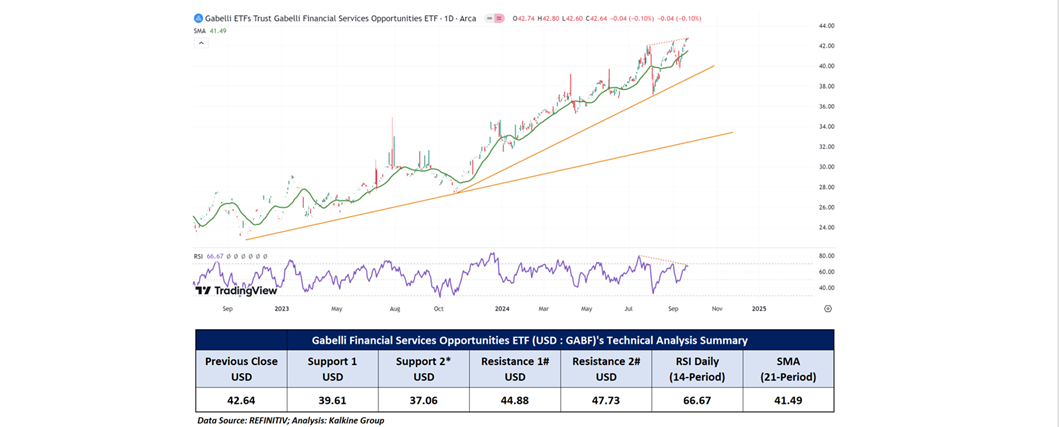
Gabelli Financial Services Opportunities ETF (GABF)
This ETF differs from traditional ETFs by not disclosing daily asset holdings, which can introduce additional risks for investors. For instance, higher trading costs may arise due to less information available, potentially leading to discrepancies between share prices and actual portfolio value, especially in volatile markets.
As of March 31, 2024, the largest allocation is in the financial services sector, which makes up 73% of its portfolio. The top three holdings are Affiliated Managers Group Inc., American Express Co, and Apollo Global Management Inc.
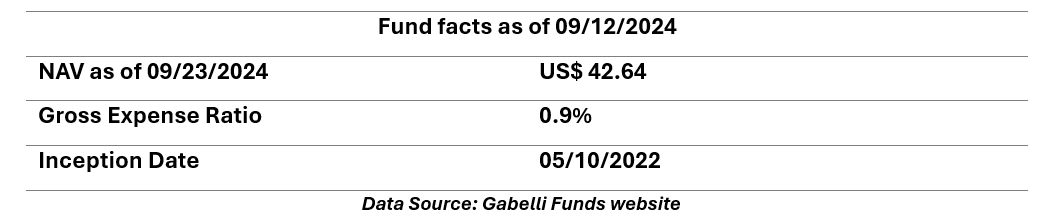
As of September 12, 2024, the fund has provided a return of 24.21% on a year-to-date basis and 35.62% over the past year.
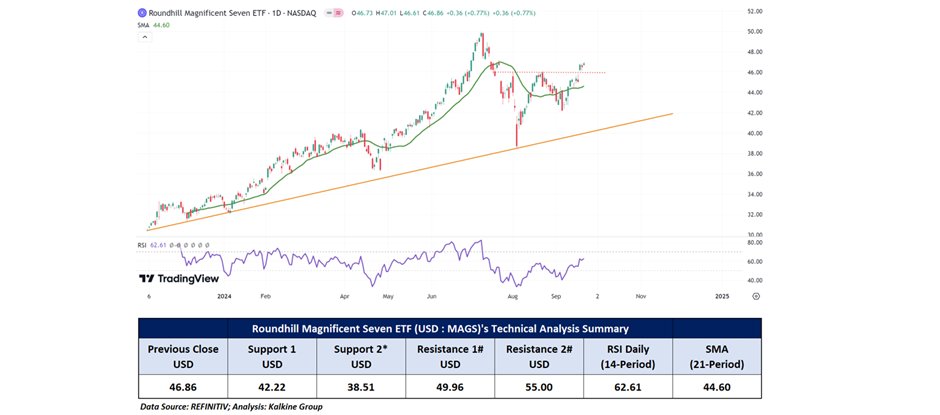
Roundhill Magnificent Seven ETF (MAGS)
The Roundhill Magnificent Seven ETF provides equal-weight exposure to the "Magnificent Seven" stocks: Alphabet, Amazon, Apple, Meta, Microsoft, Nvidia, and Tesla. MAGS is the first ETF designed to track these seven prominent companies.
The ETF's allocation highlights a diverse selection of leading technology and consumer companies. As of September 22, 2024, Tesla Inc. leads with 17.74%, followed by Meta Platforms Inc. at 15.47% and Apple Inc. at 14.98%. Amazon.com Inc. holds 13.80%, while Microsoft Corp. accounts for 13.20%. NVIDIA Corp. and Alphabet Inc. Class A make up 12.48% and 12.40%, respectively.
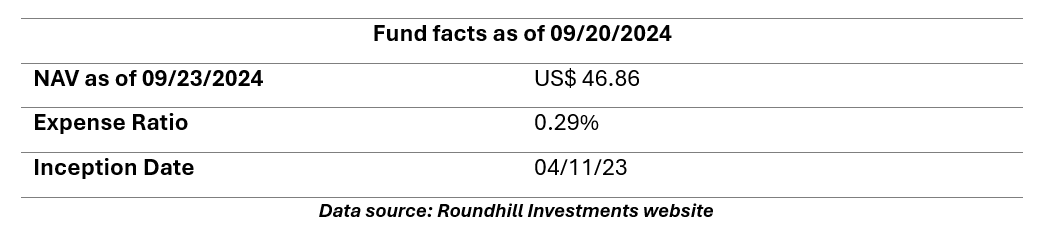
As of June 30, 2024, the fund has provided a return of 49.77% in the past year and 82.91% since inception.
Conclusion
Investors looking for diversified options in the US equity market can explore these ETFs, each demonstrating significant returns over the past year. With their flexibility, lower costs, and real-time trading capabilities, ETFs serve as an attractive alternative to traditional mutual funds. When selecting an ETF, it's essential to consider individual sector preferences, risk tolerance, and the specific performance of the underlying index.
However, it's important to remember that past performance is not a reliable indicator of future results.
Note 1: Past performance is not a reliable indicator of future performance.
Technical Indicators Defined: -
Support: A level at which the stock prices tend to find support if they are falling, and a downtrend may take a pause backed by demand or buying interest. Support 1 refers to the nearby support level for the stock and if the price breaches the level, then Support 2 may act as the crucial support level for the stock.
Resistance: A level at which the stock prices tend to find resistance when they are rising, and an uptrend may take a pause due to profit booking or selling interest. Resistance 1 refers to the nearby resistance level for the stock and if the price surpasses the level, then Resistance 2 may act as the crucial resistance level for the stock.
The reference date for all price data, currency, technical indicators, support, and resistance levels is September 23, 2024. The reference data in this report has been partly sourced from EODHD/Others.
Abbreviations
CMP: Current Market Price
SMA: Simple Moving Average
AUD: Australian Dollar
RSI: Relative Strength Index
